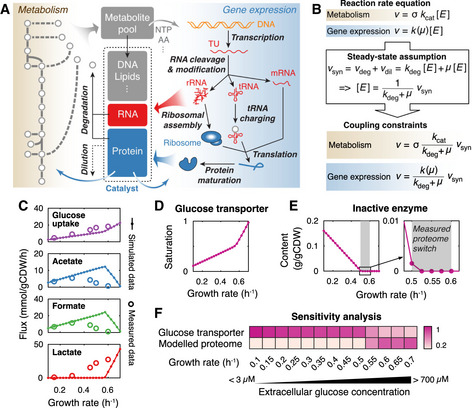
Figure 1. Overview of pcLactis and simulations of glucose‐limited conditions.

- The model explicitly accounts for reactions of metabolism and gene expression processes. Metabolic reactions produce metabolites and energy for not only biomass formation but also gene expression processes. The reactions of gene expression, on the other hand, synthesize RNA and proteins, which catalyze reactions of metabolism and gene expression processes as machineries or enzymes. In addition, pcLactis accounts for degradation of mRNA and proteins as well as dilution of biomass constituents during cell division.
- Coupling constraints in pcLactis. The coupling constraint allows for relating the reaction rate to the synthesis rate of its catalyst based on the reaction rate equation and steady‐state assumption, where turnover rates k cat of metabolic enzymes, catalytic rates k of machineries, and degradation constants k deg of the catalysts are needed.
- Simulated exchange fluxes compared with experimentally measured data (Goel et al, 2015).
- Simulated saturation of glucose transporter.
- Simulated inactive enzyme. The inactive enzyme is the sum of the enzymes that are synthesized but do not carry fluxes. The production of the inactive enzyme indicates that total proteome is not constrained. The gray area represents where the proteome switch occurs in experiments (Goel et al, 2015), which is between 0.5 and 0.6/h.
- Sensitivity analysis for glucose transporter and modeled proteome at different growth rates. Color represents the sensitivity score. A higher score indicates a greater impact of a given increase in the constraint on growth rate.
