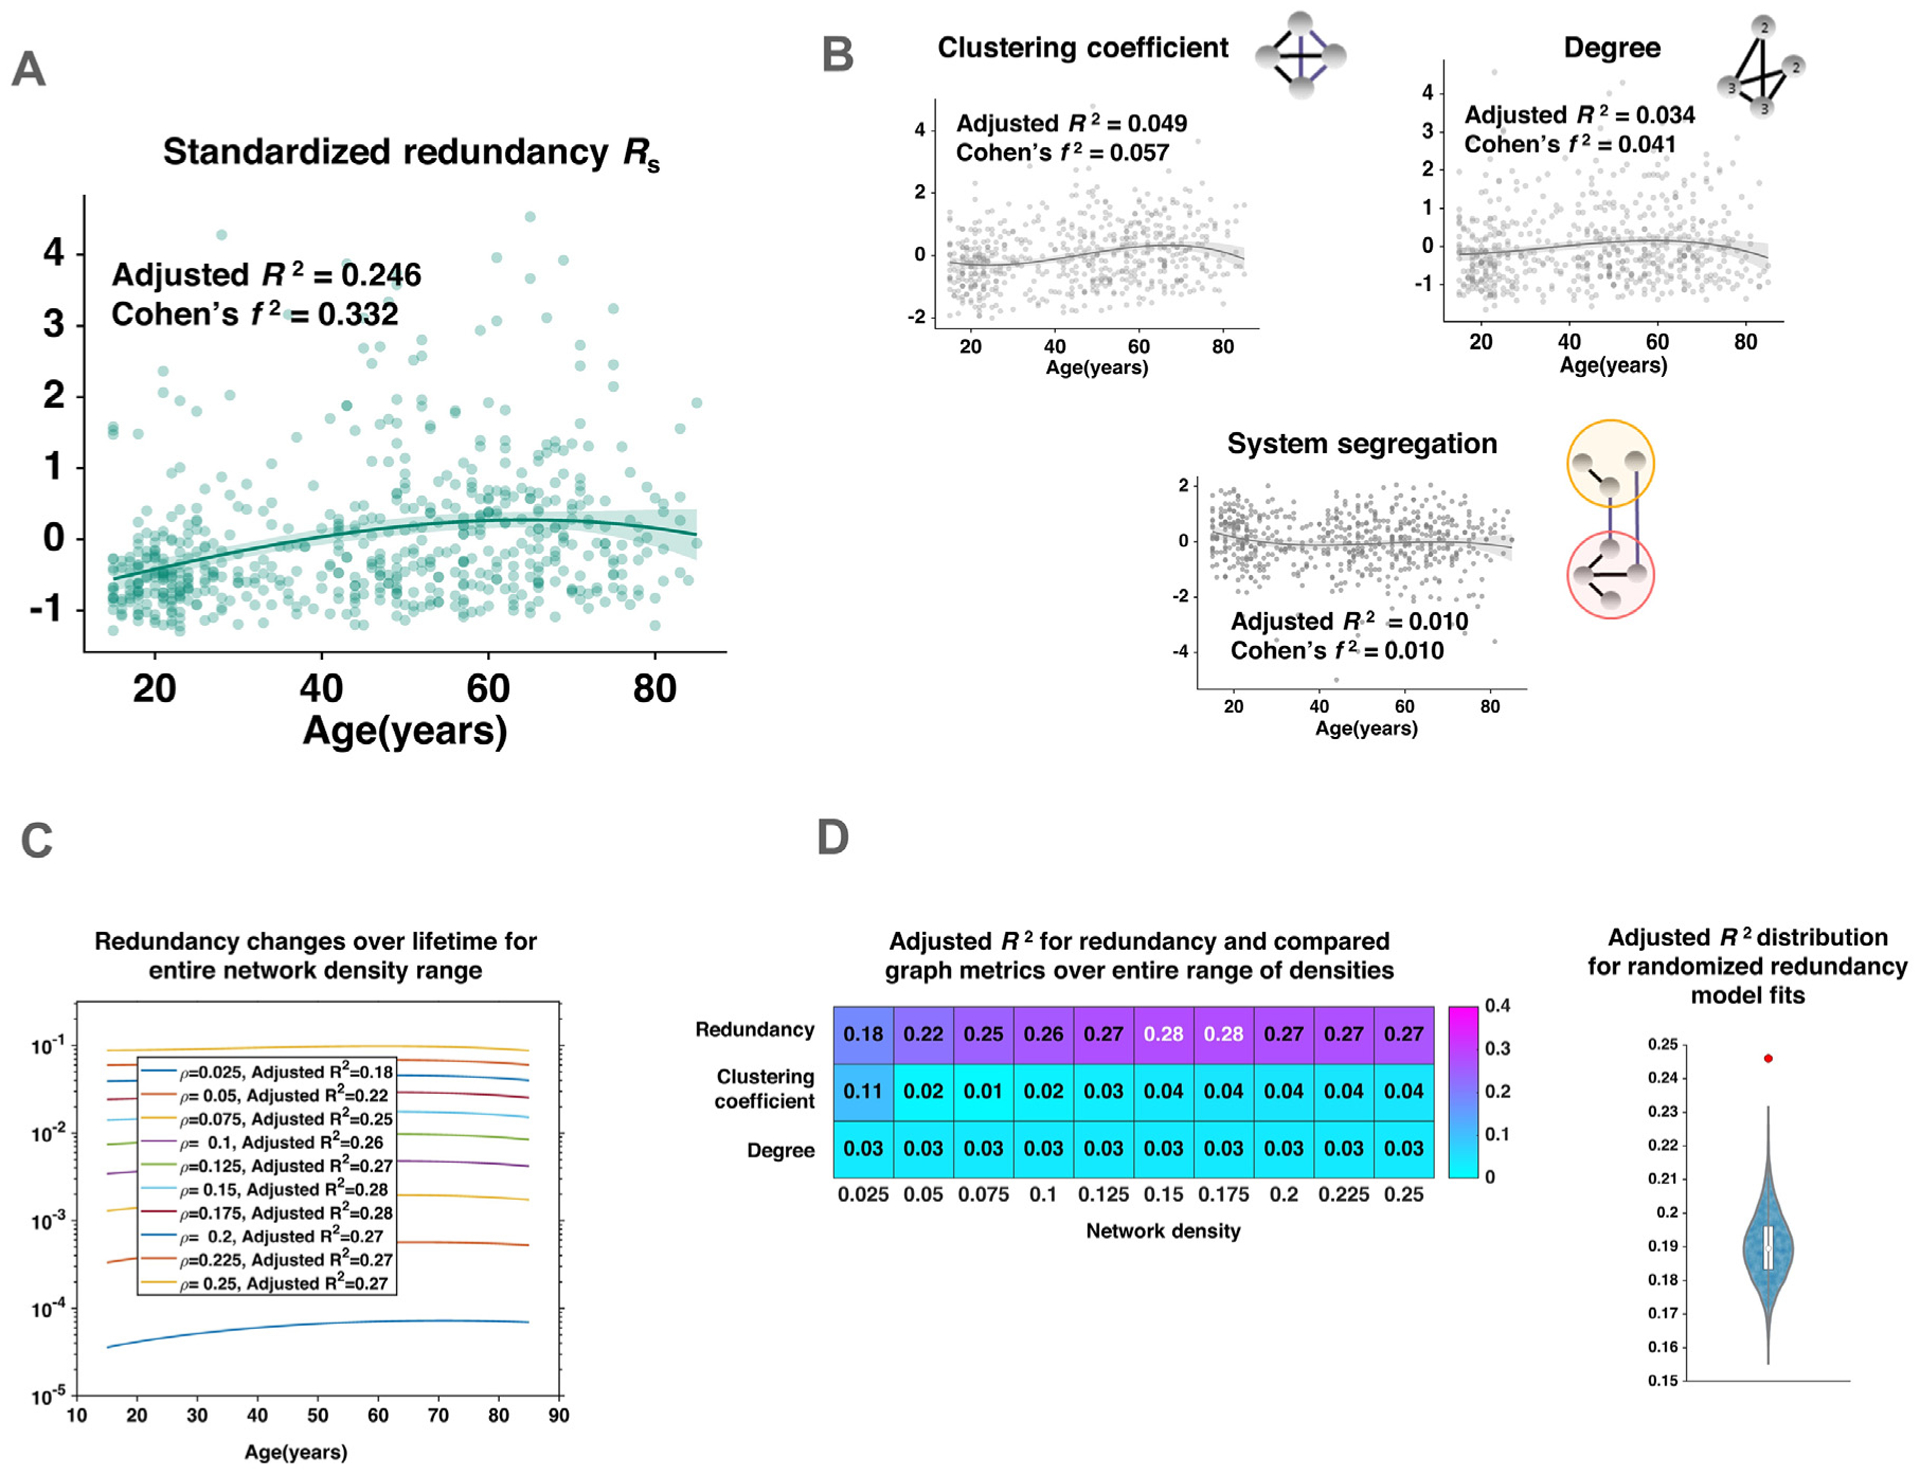
Fig. 2.

Association of whole brain redundancy with age over the human lifespan. A: A 3rd-order polynomial was fit to redundancy; points represent redundancy of individual subjects, line shows polynomial fit with 95% confidence interval (shaded), redundant edges accumulated over the earlier years of age and declined over the last decades, B: Variation of standardized clustering coefficient, degree and system segregation with age over the lifespan; lines show polynomial fit with 95% confidence interval (shaded), polynomial fits to clustering coefficient, degree and segregation show much lower Adjusted R2, C: Effect of different network densities on the association of redundancy and age, with network density denoted as ρ, D: (left) Comparison of Adjusted R2 for polynomial fit of redundancy in comparison with those of clustering-coefficient and degree, (right) Distribution of redundancy fits obtained from randomized null graphs, along with the original model fit shown in red.
