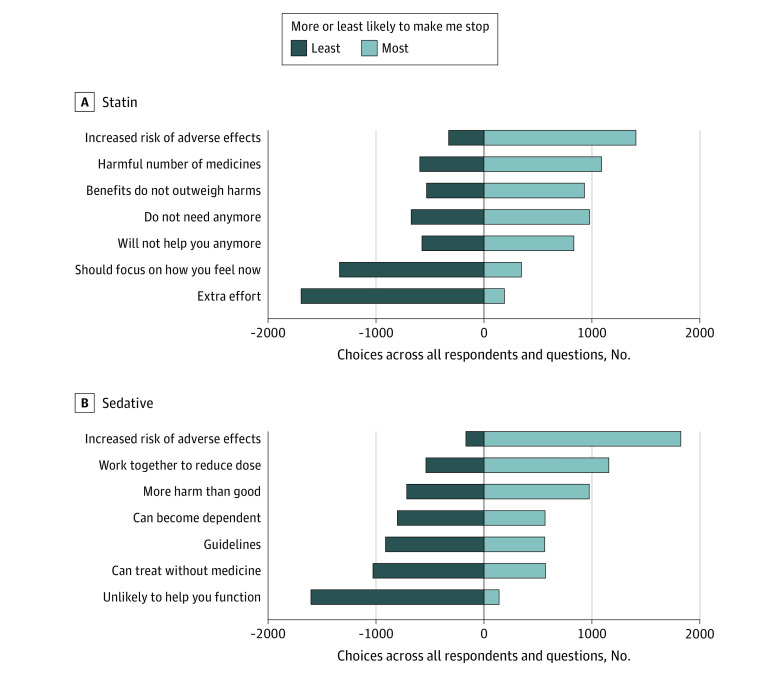
Figure 2. Variability of Preferences Between Individuals.
The figure shows the number of times each explanation was chosen as most and as least likely to make a participant stop the medicine, ranked from most likely (right) to least likely (left). Each explanation was presented 3 times to each participant, so the maximum number of times it could be chosen as most or least likely was 2505.

