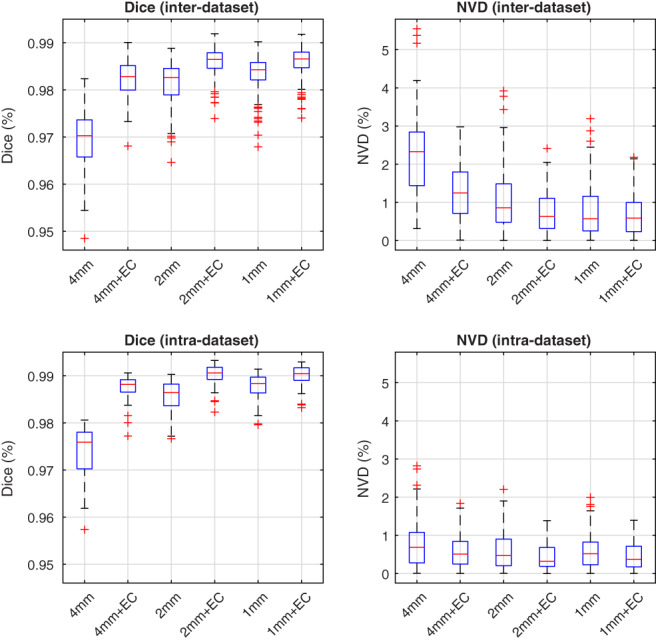
Figure 2.

Effect of early termination on the multi‐scale patch‐based label fusion. Distributions of Dice coefficients and NVD values are shown both before and after error correction (EC), in the inter‐ and intra‐dataset segmentation experiments. Centre lines: median, boxes: interquartile range, whiskers: truncated range, “+”: outliers [Color figure can be viewed at wileyonlinelibrary.com]
