
Figure 3.
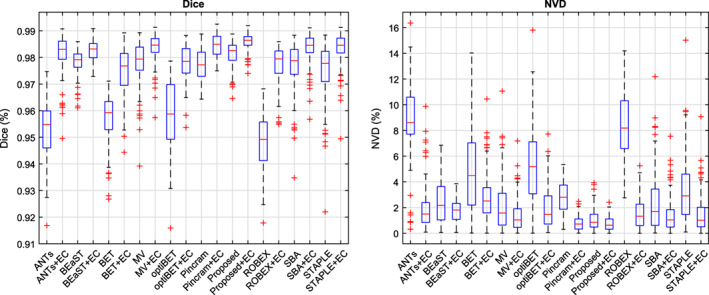
Distributions of Dice coefficients and normalized volume difference (NVD) values for each method, both before and after error correction (EC), in the inter‐dataset segmentation scenario. Centre lines: median, boxes: interquartile range, whiskers: truncated range, “+”: outliers [Color figure can be viewed at wileyonlinelibrary.com]