
FIGURE 3.
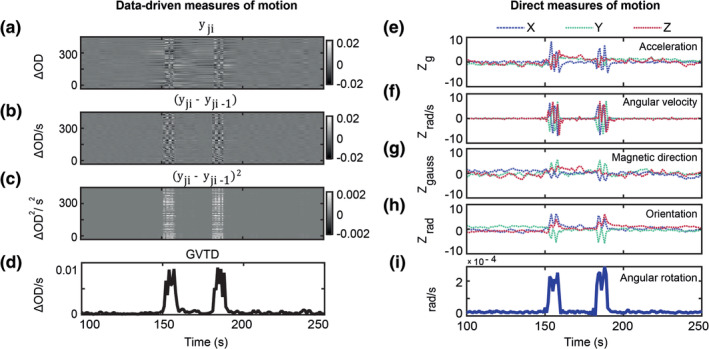
(a) All 850 nm nn1 measurements (n = 322) for a run containing instructed roll motion, represented as a matrix of measurements by time. (b) Temporal derivative of the data shown in (a); note intensified contrast between instructed motion versus neighboring time points. (c) Squared values (by element) of the matrix shown in (b). (d) GVTD time‐course is calculated as the RMS of the squared values shown in (c). (e–h) Standardized (Z‐scored) time‐courses captured during instructed head motion in one subject. Colored traces correspond to x‐, y‐, and z‐axes of the (e) accelerometer, (f) gyroscope, (g) compass, and (h) head orientation. (i) Angular rotation is calculated as the norm of the temporally differentiated x, y, and z time‐courses shown in (h)