
FIGURE 4.
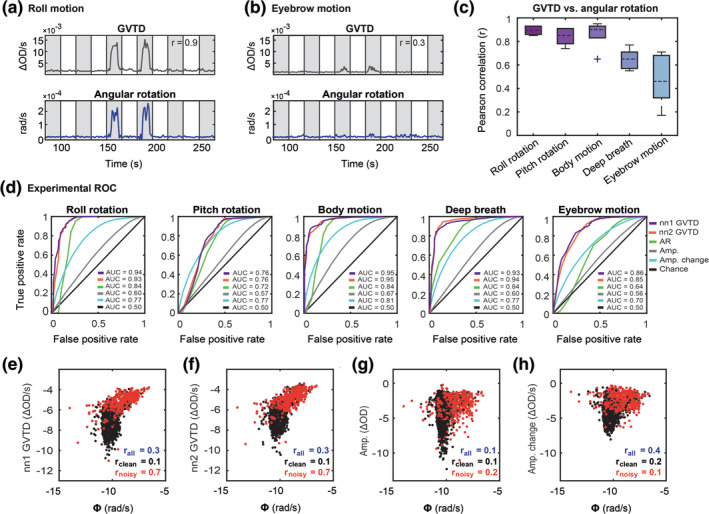
GVTD and angular rotation for an example HW run containing instructed (a) roll and (b) eyebrow motion artifacts. Gray shaded regions indicate auditory stimulation. The Pearson correlations between each pair is noted on the GVTD plots. (c) Pearson correlation between GVTD and angular rotation averaged over the six subjects with instructed motion runs. Note a high Pearson correlation of GVTD with roll, pitch, and body motion. (d) Experimental ROC plots for GVTD based on nn1 and nn2 measurements and angular rotation and the mean of the ROCs for signal amplitudes (Amp.) and windowed amplitude changes (Amp. change) for five types of instructed motion. Log–log scatter plots of 850 nm (e) nn1 GVTD, (f) nn2 GVTD, (g) nn1 signal amplitudes, (h) nn1 windowed amplitude changes versus angular rotation are shown for all runs with instructed motion. The correlation between the GVTD (either nn1 or nn2) and the motion sensor is higher than both amplitudes and the windowed amplitude changes. The cutoff between black and red dots is based on the instructed motion time points