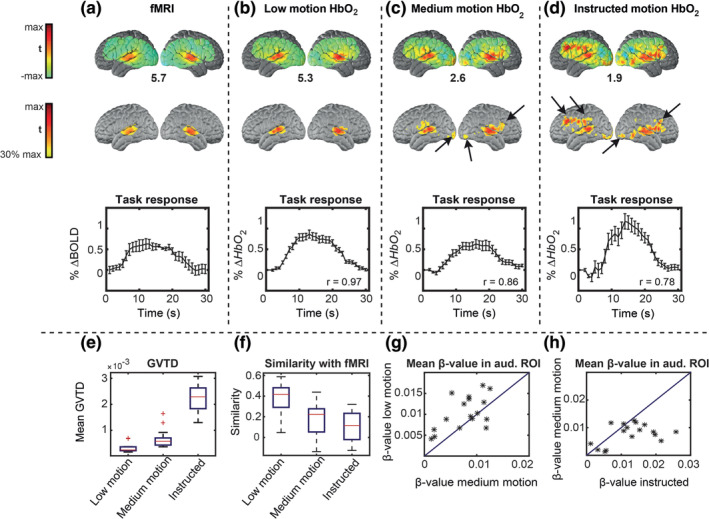
FIGURE 6.

HW task t‐statistic evoked responses. Voxel‐wise maps are shown in the first and second rows; the percent signal changes are averaged over a region of interest (ROI) and shown in the third row. Error bars on the time‐courses indicate standard error of the mean across sessions. (a) Reference data set. (b) Low motion data. (c) Medium motion data. (d) Instructed motion data. Black arrows indicate false‐positive responses, designated since they occur outside auditory ROI defined based on the reference fMRI data set. The maximum t‐value of each group is shown below the maps. (e) Mean GVTD values across all trials in low motion, medium motion, and instructed motion data. (f) Mean similarity of the maps in each condition with the reference data set; similarity defined as the voxel‐voxel Pearson correlation. (g) Scatter plot of responses in low versus medium motion ordinary trials; GVTD indexed stronger responses in low motion trials in 15 of 17 sessions. (d) Scatter plot of medium motion versus instructed motion trials; note the higher spurious response magnitudes for the instructed motion
