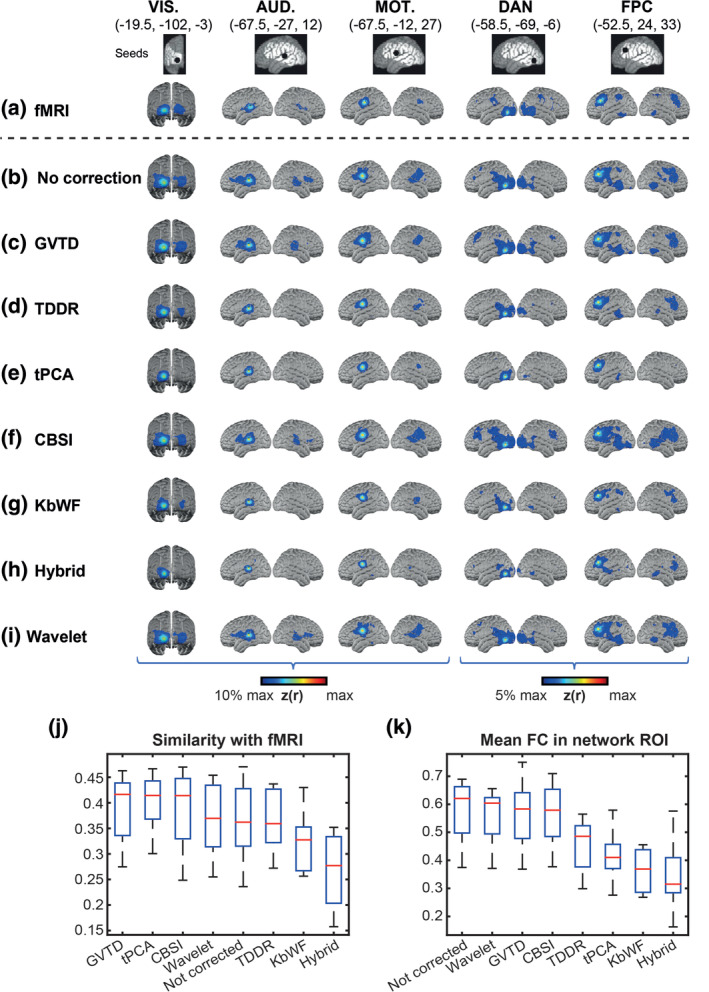
FIGURE 8.

Comparison between different motion removal methods on resting state HD‐DOT data in Data set 4 and gold standard fMRI data. Five columns represent the seed maps for visual (VIS.), auditory (AUD.), somatomotor (MOT.), dorsal attention (DAN), and frontoparietal (FPC) networks. (a) fMRI maps based on reference Data set 1. HD‐DOT maps for Data set 4 with (b) no motion correction, (c) GVTD‐based motion censoring, (d) TDDR, (e) tPCA, (f) CBSI, (g) kbWF, (h) hybrid, and (i) wavelet motion correction methods. Spatial similarity (j) was computed as the Fisher's z‐transformed spatial correlation between the HD‐DOT and fMRI FC maps, evaluated over the HD‐DOT FOV (white area illustrated in the top row). (k) ROI‐based FC was evaluated as the mean Fisher's z‐transformed correlation with the seed in the colored regions shown in panel (a). These regions were determined by thresholding the group‐level fMRI FC maps at 10% for lower‐level networks (VIS., AUD., and MOT.) and 5% for higher‐level networks (DAN and FPC) of maximum z(r) value
