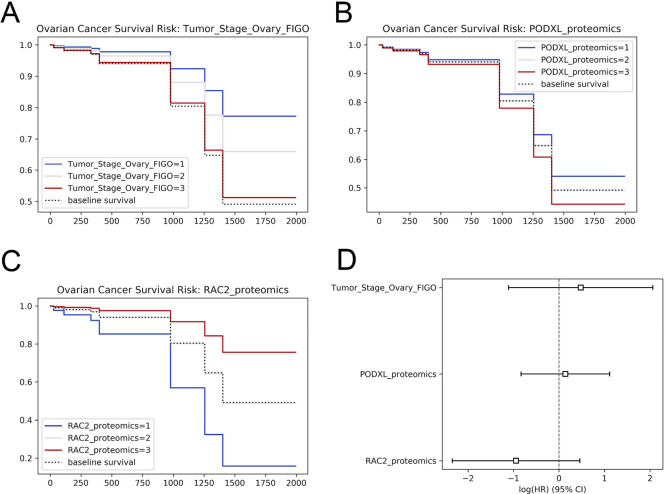
Figure 3.
Survival analysis with CPTAC data. Using the lifelines Python module, we identify variables that impact patient survival in ovarian cancer. A Kaplan–Meier curve is shown to separate time to death based on: (A) the FIGO stage, (B) the protein expression of PODXL, and (C) RAC2. A Cox proportional hazard assessment is shown in panel D. The images were generated using the code in use case 9 of the cptac documentation (https://paynelab.github.io/cptac/usecase09_clinical_outcomes.html).

