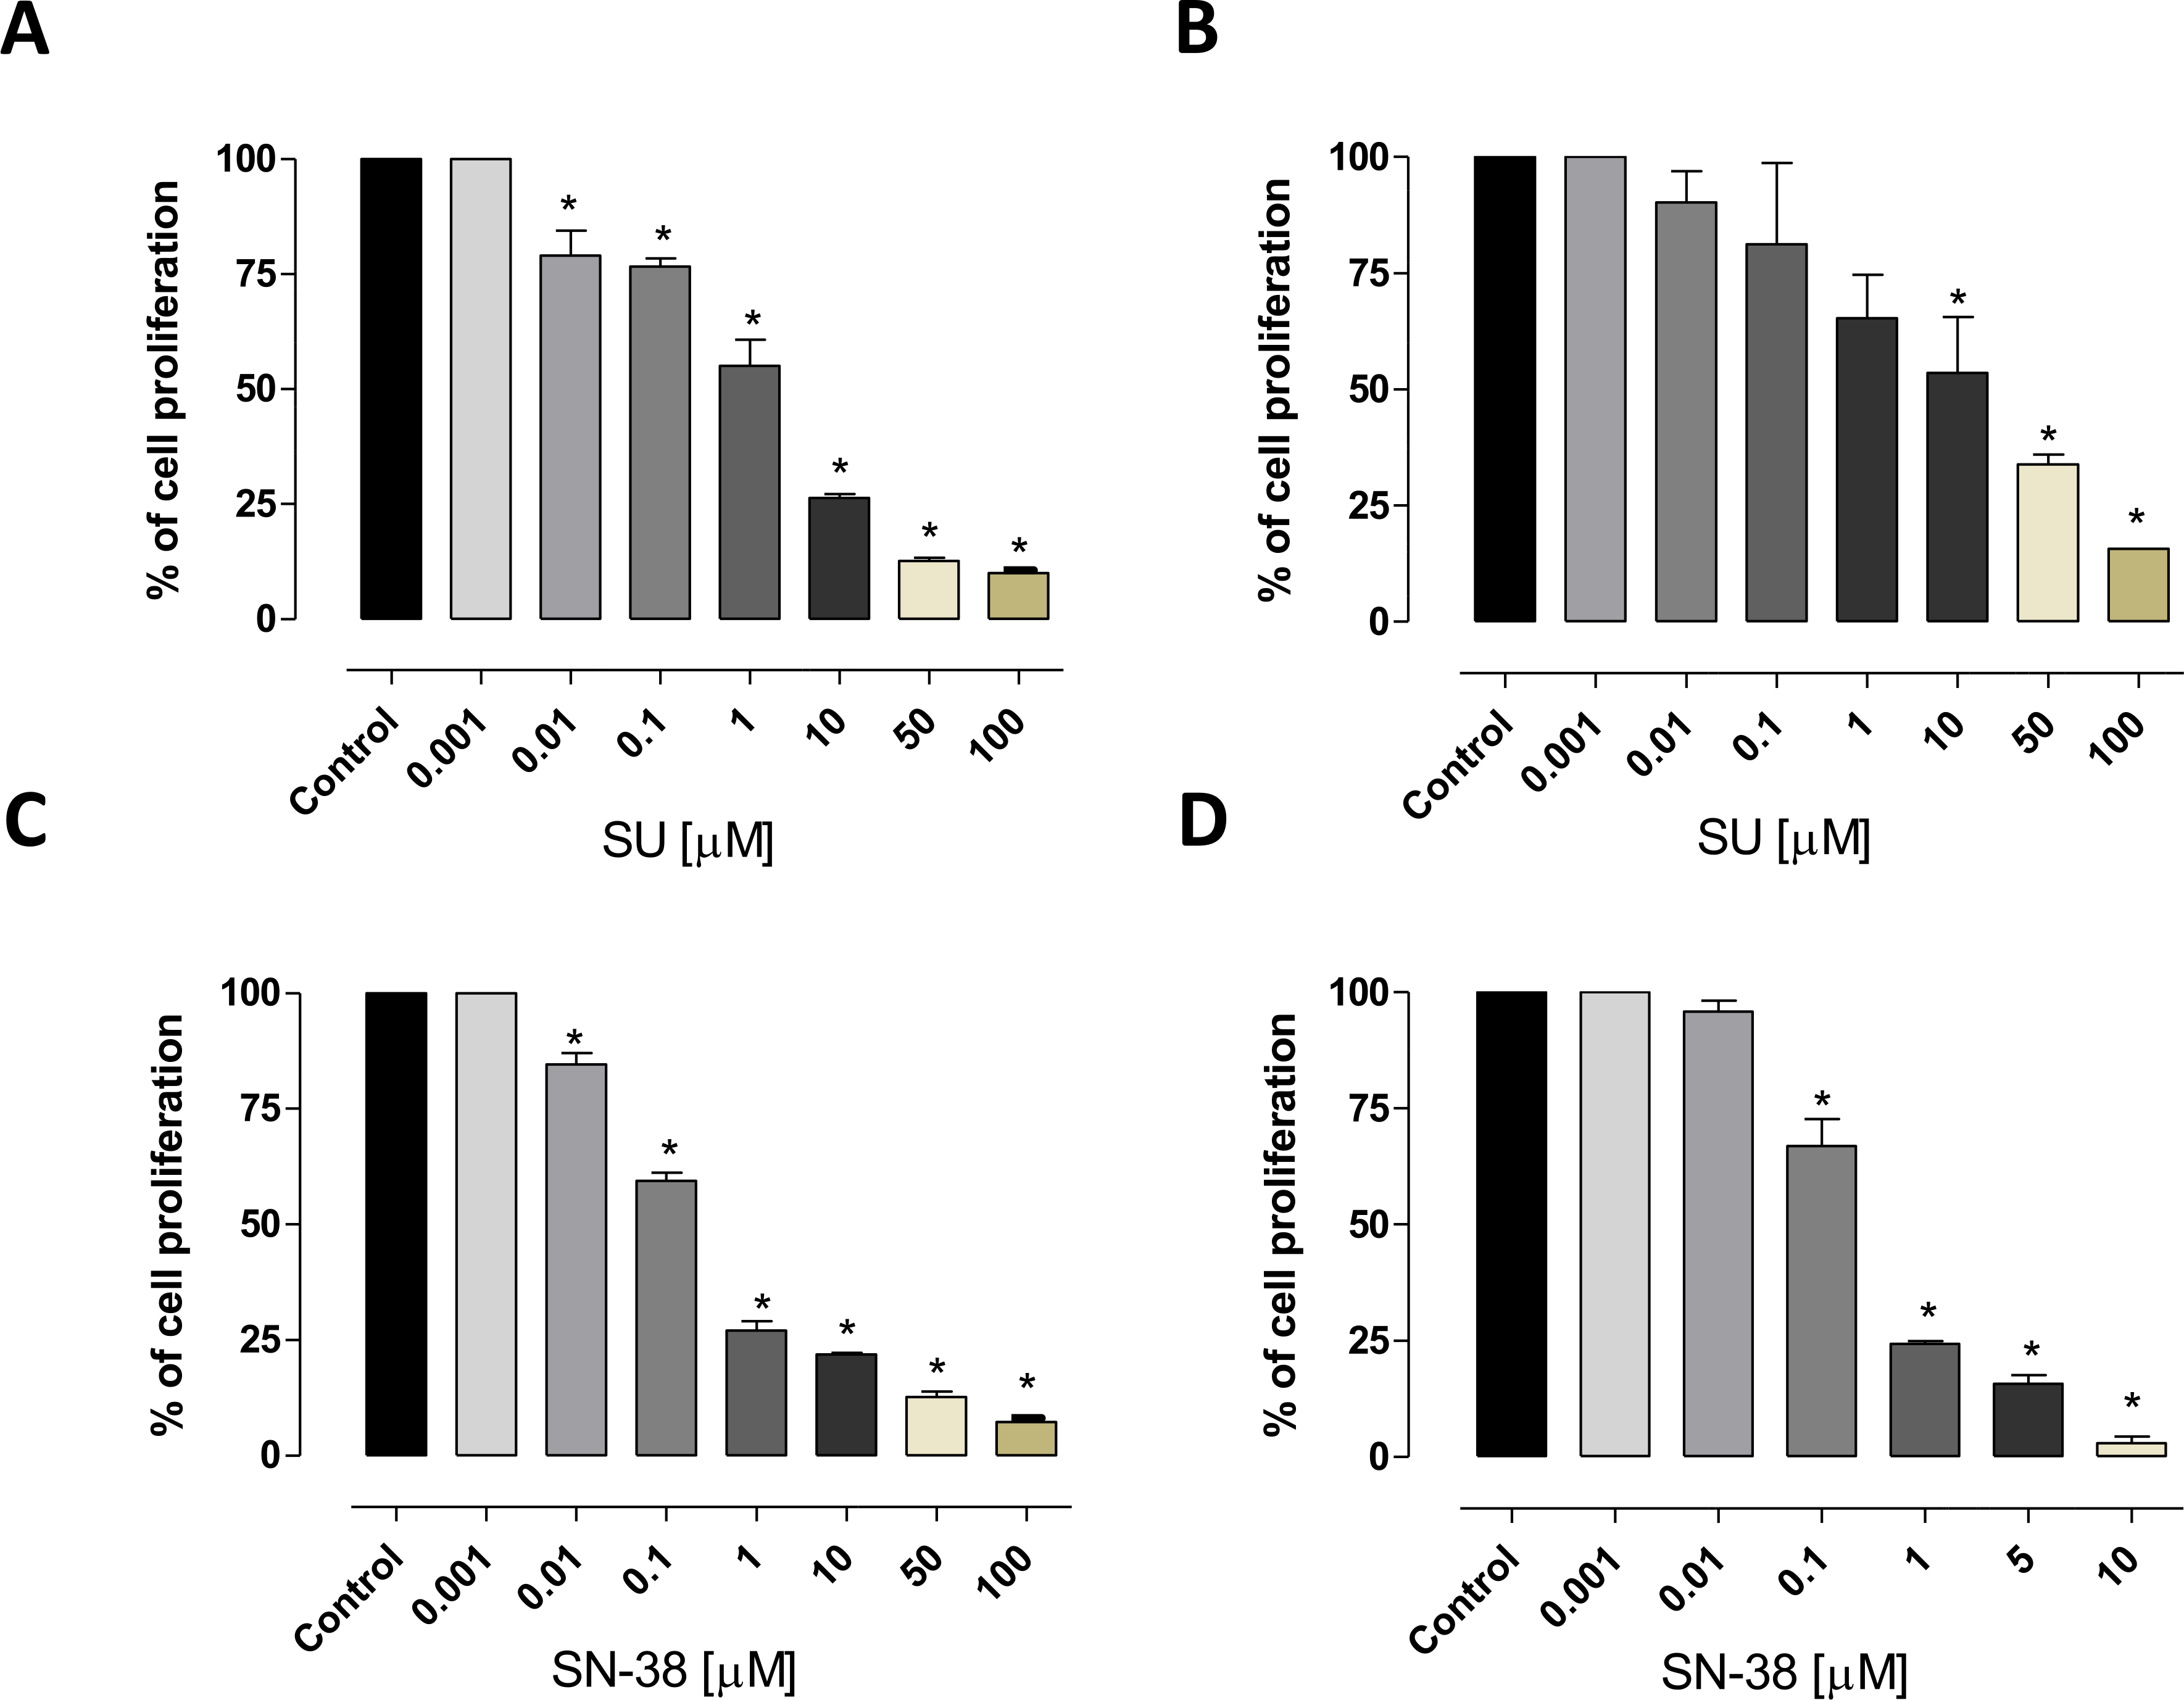
Fig. 1.

Antiproliferative effects of sunitinib (SU) and SN-38 in vitro on 8305C (A and C, respectively), and FB3 (B and D, respectively) cell lines. The antiproliferative effects of the drugs were studied after 72 h of exposure. The data are presented as percentage of vehicle-treated cells. The concentrations of drug that reduced cell proliferation by 50% (IC50) vs controls were calculated by a nonlinear regression fit of the mean values of the data obtained in triplicate experiments (i.e. at least 9 wells for each concentration). Columns and bars, mean values ± S.E., respectively. *, P < 0.001 vs. control.
