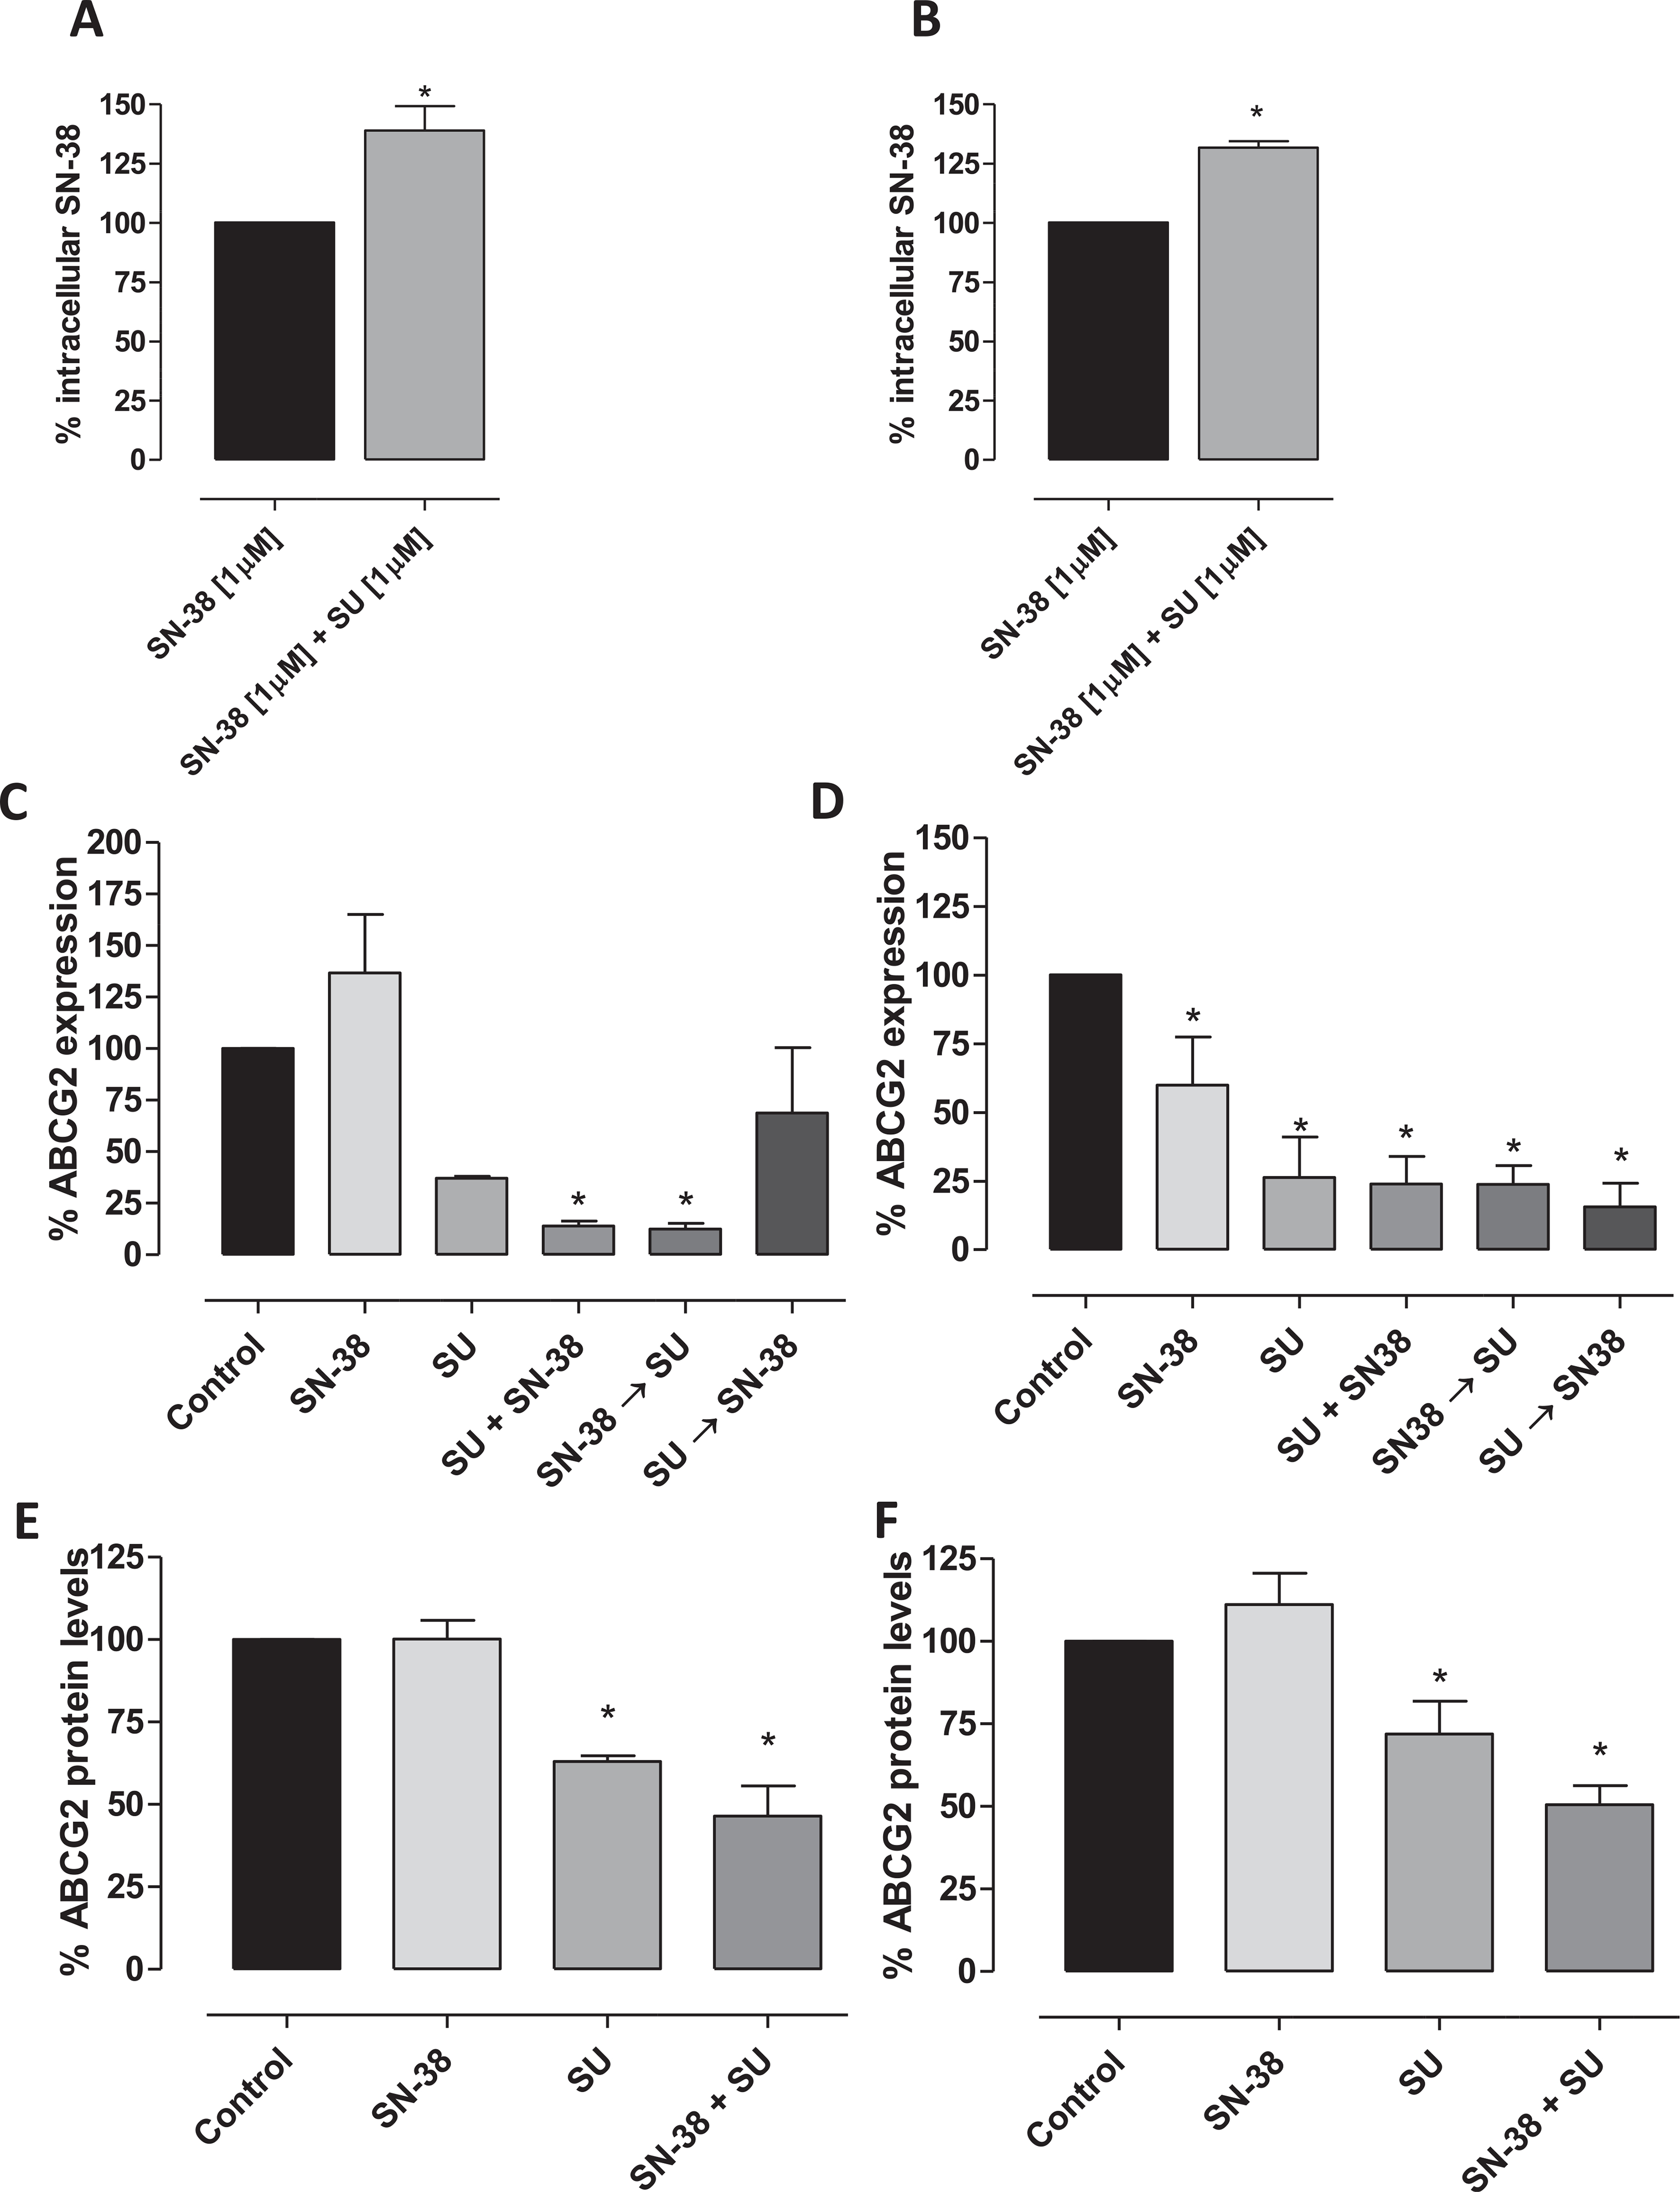
Fig. 3.

Accumulation of SN-38 (ng · mg−1 protein) in 8305C (A) and FB3 (B) cell lines after exposure to 1 μM SN-38 alone and in combination with sunitinib (SU). Columns and bars indicate the mean percentage values (±S.D.) vs. treated cells with SN-38 alone. ABCG2 gene expression (2−ΔΔCt) and ABCG2 (ng · mg−1 protein) protein levels in 8305C (C and E, respectively) and FB3 (D and F, respectively) cells exposed to sunitinib or with vehicle alone for 72 h. Data are expressed as percentage of vehicle-treated cells. Columns and bars, mean values ± S.D., respectively. *P < 0.05 vs. vehicle-treated controls. The quantitation of gene expression was performed using the ΔΔCt calculation, where Ct is the threshold cycle; the amount of target, normalized to the endogenous control, glyceraldehyde 3-phosphate dehydrogenase, and relative to the calibrator (vehicle treated control cells), is given as 2−ΔΔCt. The quantitation of protein levels was performed by ELISA. The optical density was determined using a Multiskan Spectrum microplate reader set to 450 nm. The results were expressed as nanograms of ABCG2 per milligram of total protein. All experiments were repeated, independently, three times.
