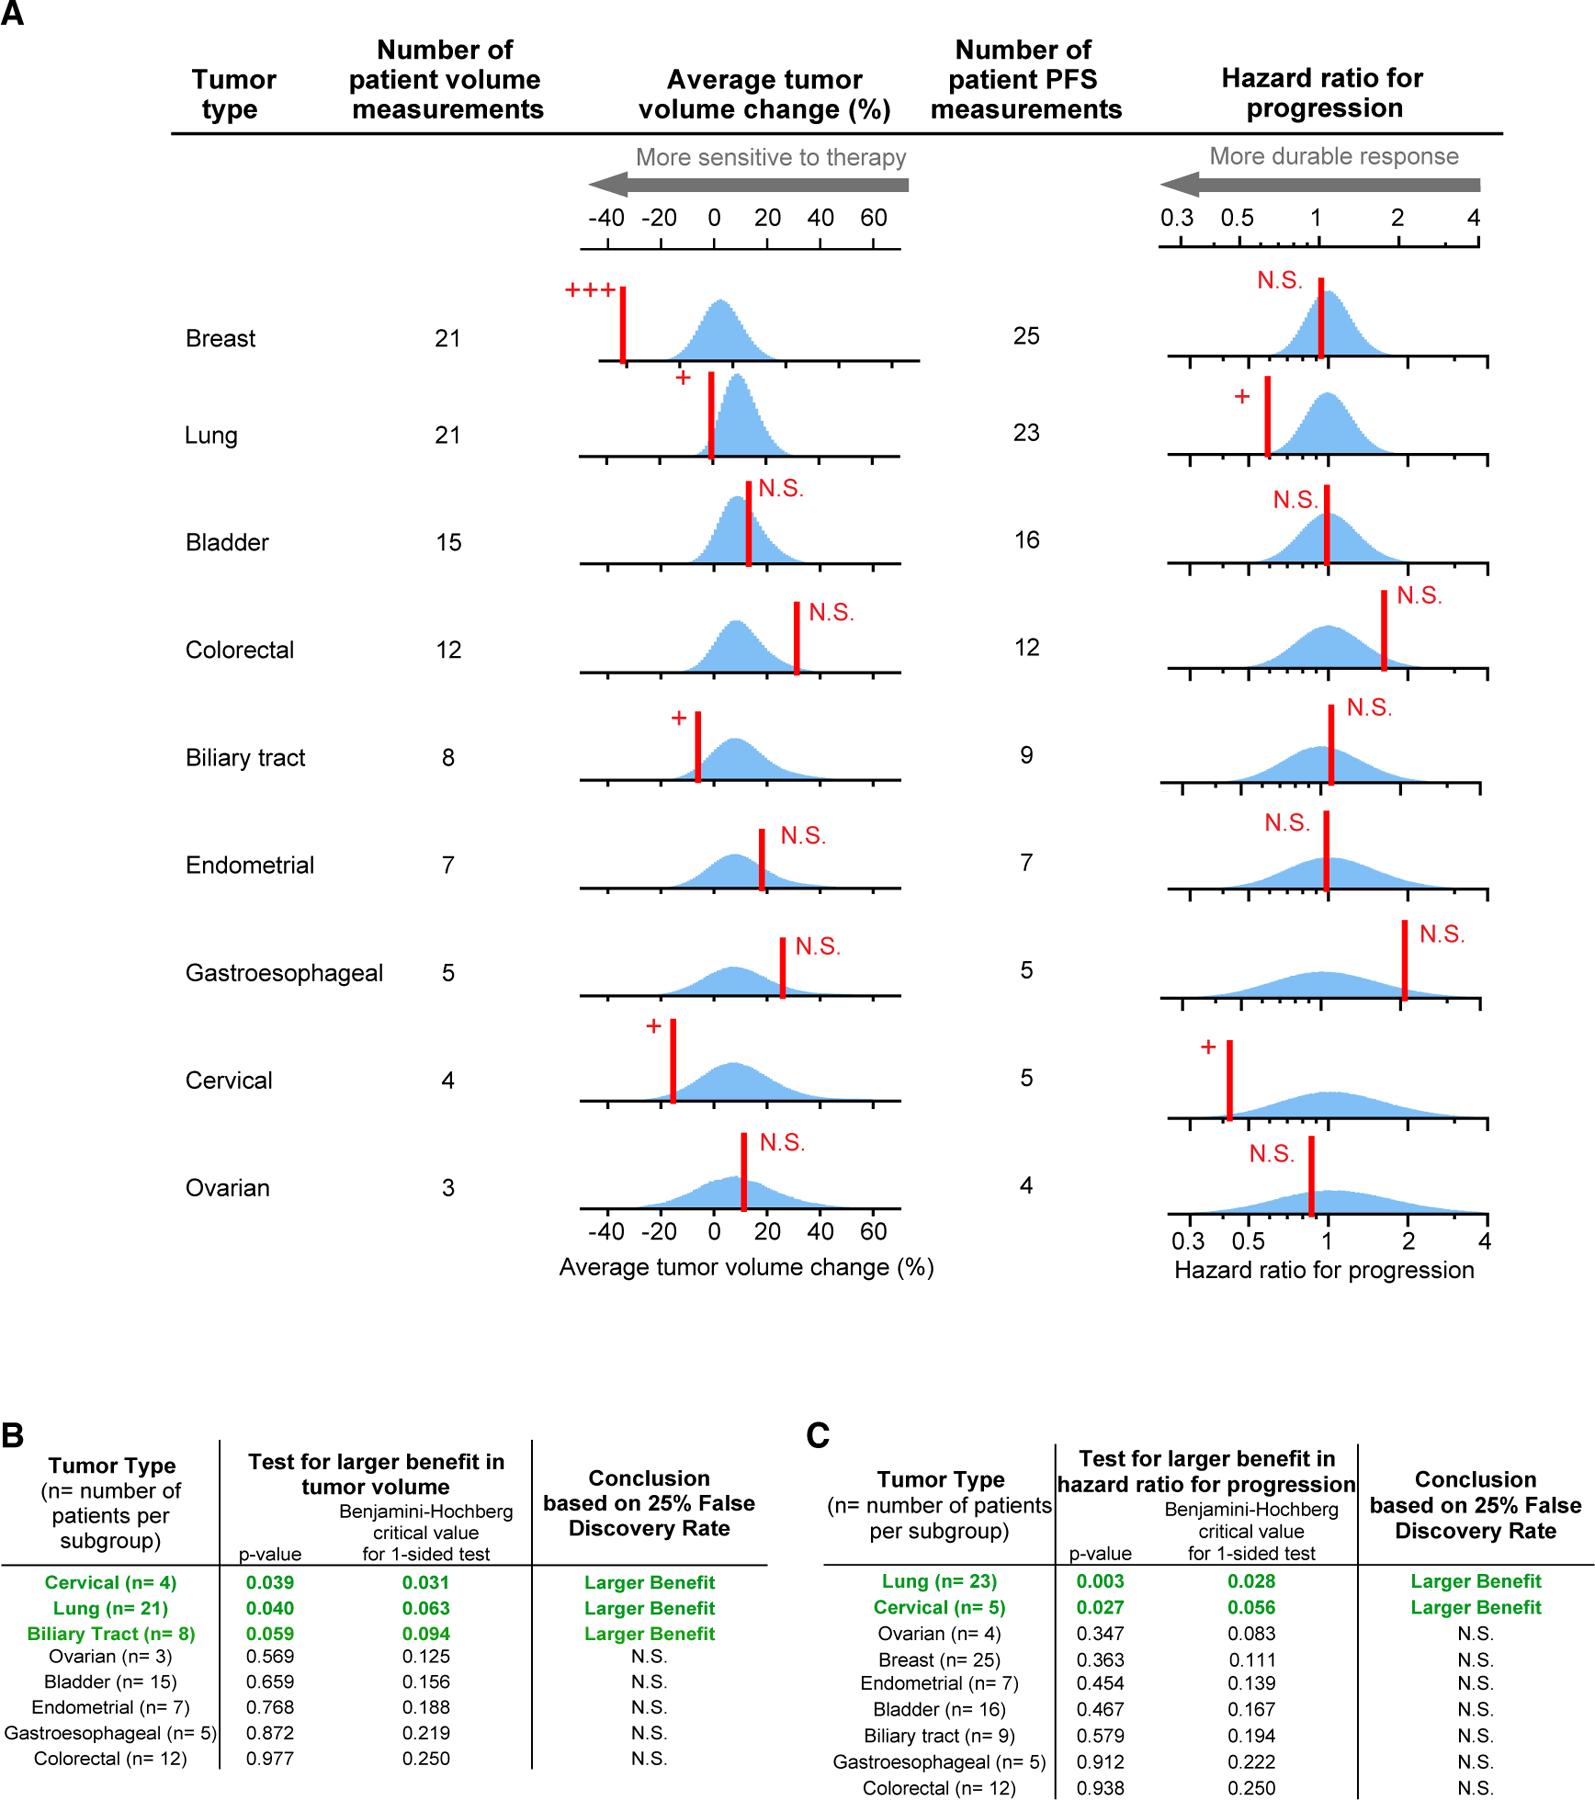
Figure 1. Analysis of Neratinib Response by Tumor Tissue of Origin.

(A) Red line, observed response; blue histogram, responses simulated according to the null hypotheses of no difference in response between tumors types. As explained in the main text, breast-tumor-volume changes are compared with null distributions drawn by Monte Carlo resampling from all tumors; for this reason, the null distribution for breast-tumor volume changes has a different mean. For all other tumor volume changes, the null distributions are drawn from all nonbreast tumors due to breast tumors being a strong outlier (p < 10−6; see STAR Methods).
(B and C) “Hazard ratio for progression” null distributions are drawn from all tumors. (B) Observed responses that significantly exceed the null hypothesis, according to Benjamini-Hochberg procedure (to control the false discovery rate during multiple hypothesis testing), are indicated with +; N.S. denotes not significant; +++ denotes p < 10−6 (B and C). (C) Observed responses that significantly exceed the null hypothesis for hazard ratio for progression, according to Benjamini-Hochberg procedure (to control the false discovery rate during multiple hypothesis testing), are indicated with +; N.S. denotes not significant; +++ denotes p < 10-6.
