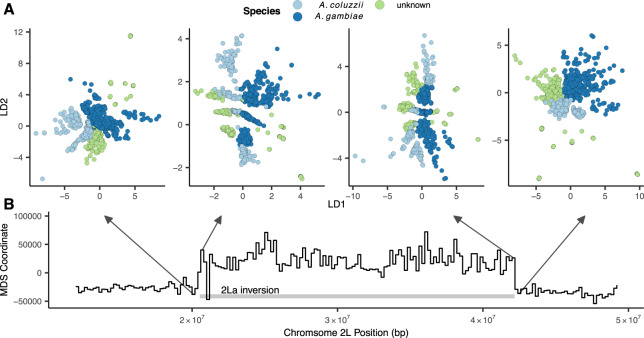
Figure 6.
Latent spaces reflect inversion karyotypes at the 2La inversion in A. gambiae/coluzzii. (A) VAE latent spaces for AG1000G phase 2 samples from windows near the 2La inversion breakpoints, colored by species. (B) Multidimensional scaling values showing difference in the relative position of individuals in latent space across windows—high values reflect windows in which samples cluster by inversion karyotype, and low values by species.

