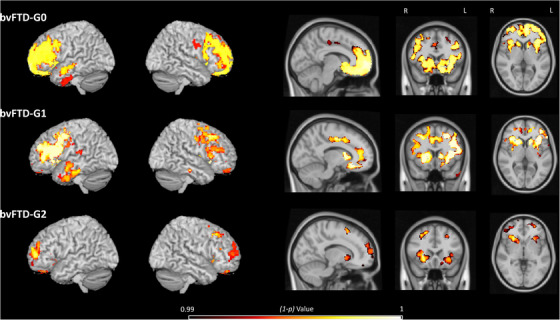
FIGURE 4.

Voxel‐based morphometry–derived gray matter atrophy maps of each behavioral variant of frontotemporal dementia (bvFTD) subgroup: bvFTD‐G0 group of outliers (N = 3), bvFTD‐G1 (N = 6), and bvFTD‐G2 (N = 6). The (1‐p) value maps show the atrophy patterns compared to healthy controls (HC, N = 15) and are superimposed onto a whole‐brain Montreal Neurological Institute template. Effects are corrected for age and sex, and for family‐wise error at the whole brain level at P < .01
