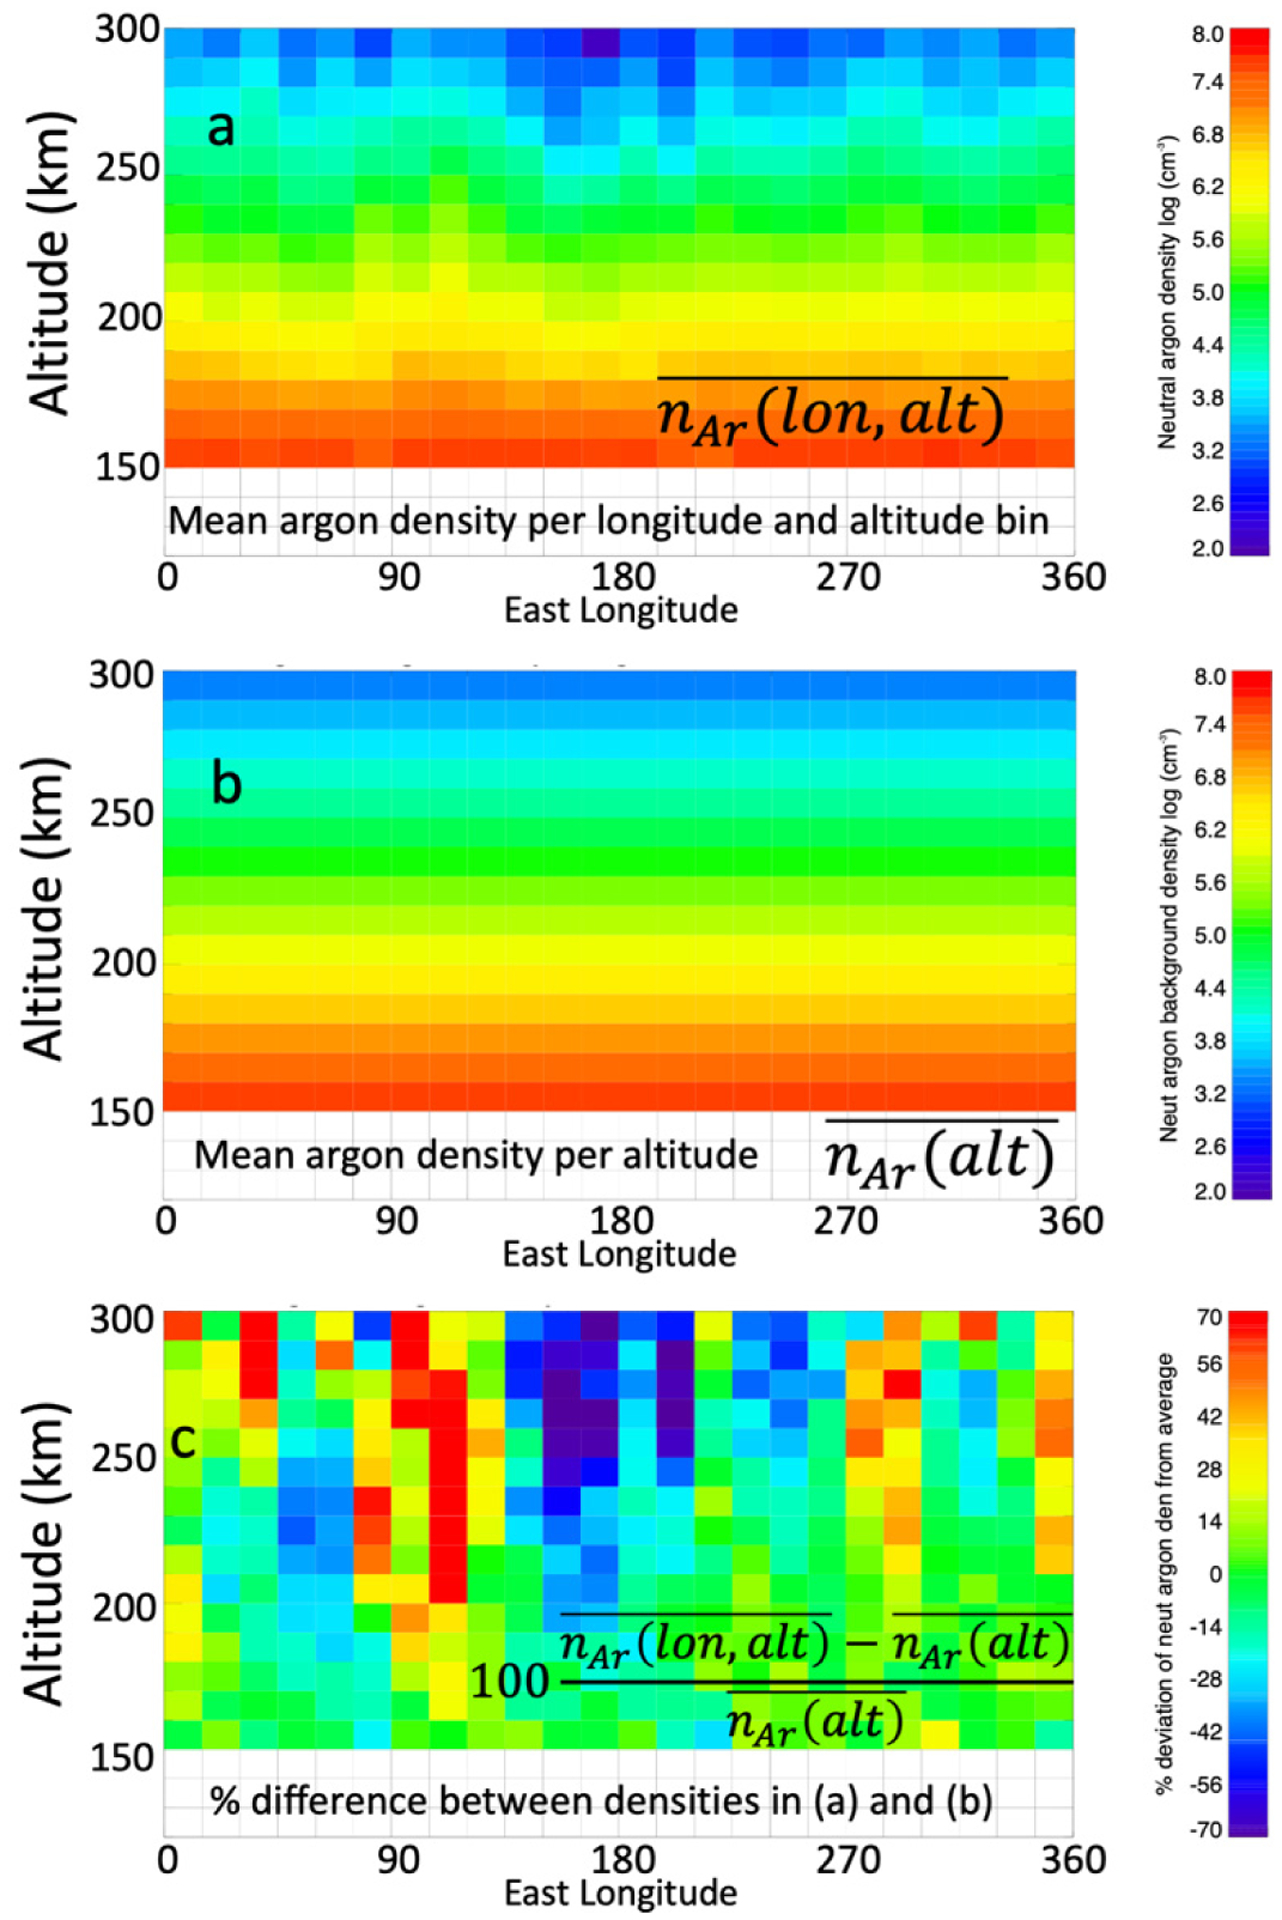
Figure 1.

Illustration of tidal wave perturbation extraction with an example using Mars Atmosphere and Volatile Evolution (MAVEN) neutral argon number densities from 26 March–14 April 2016. Panel (a) shows the mean neutral argon number densities in bins of 10 km by 15° longitude. Panel (b) shows the mean neutral argon number densities in altitude for all longitudes. Panel (c) shows the percent difference between the mean argon densities in (a) and (b).
