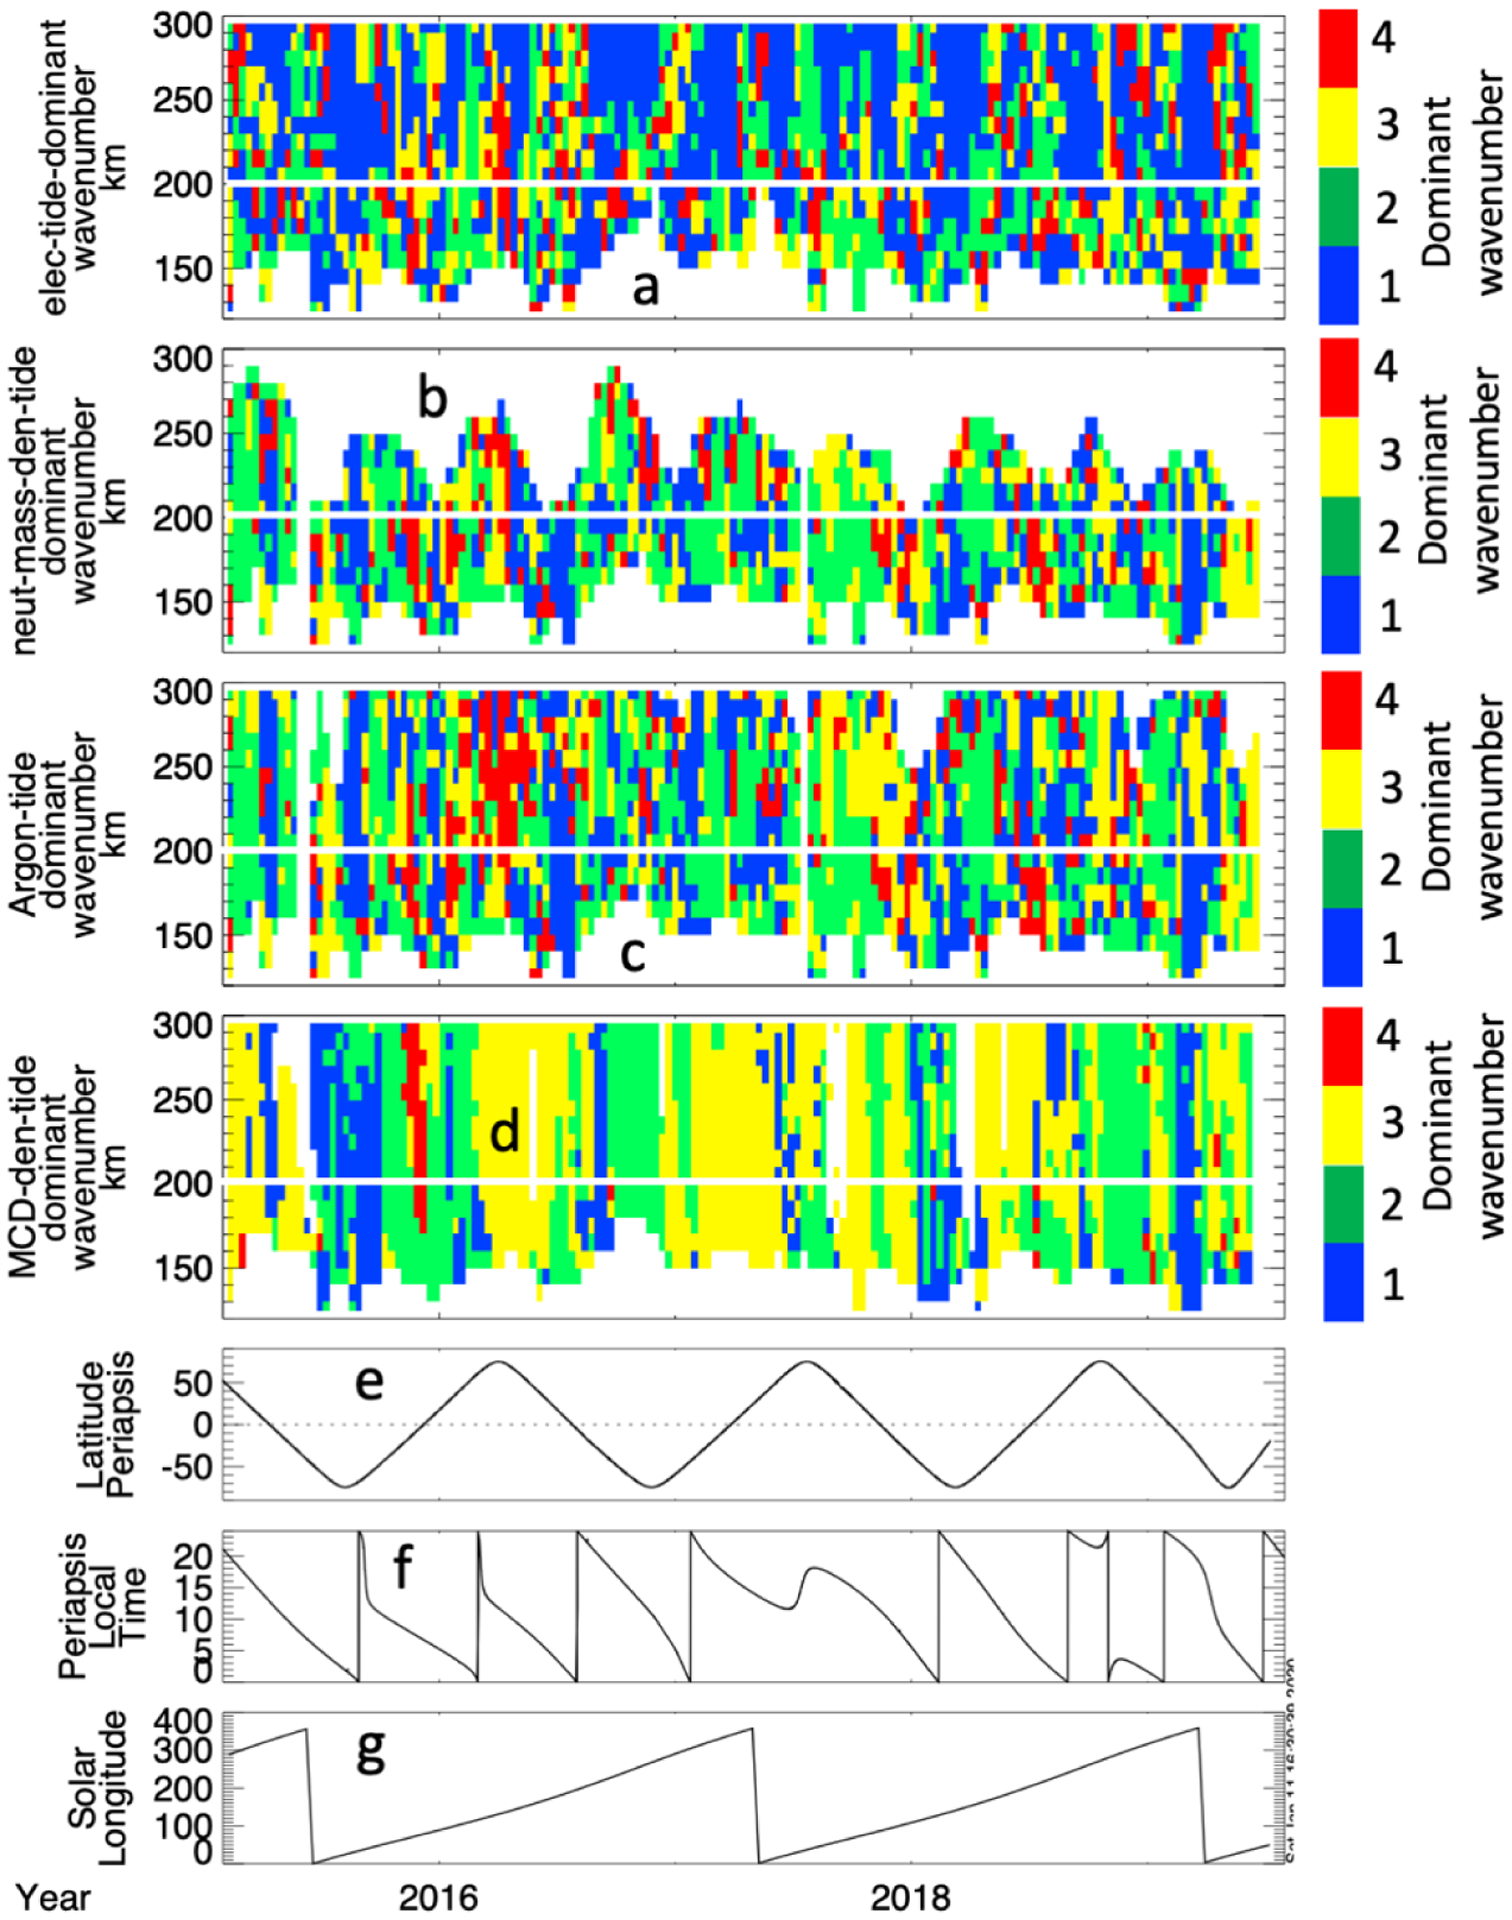
Figure 10.

The dominant wave number, as determined from the fourth order harmonic fit, as a function of altitude and time from February 2015–July 2019 for the tidal variations observed in electron density (a), neutral mass density (b), neutral argon density (c), and modeled (MCD) neutral mass density (d). The local time (e), solar longitude (f), and latitude (g), are given for context. The white horizontal line marks 200 km.
