
Figure 3.
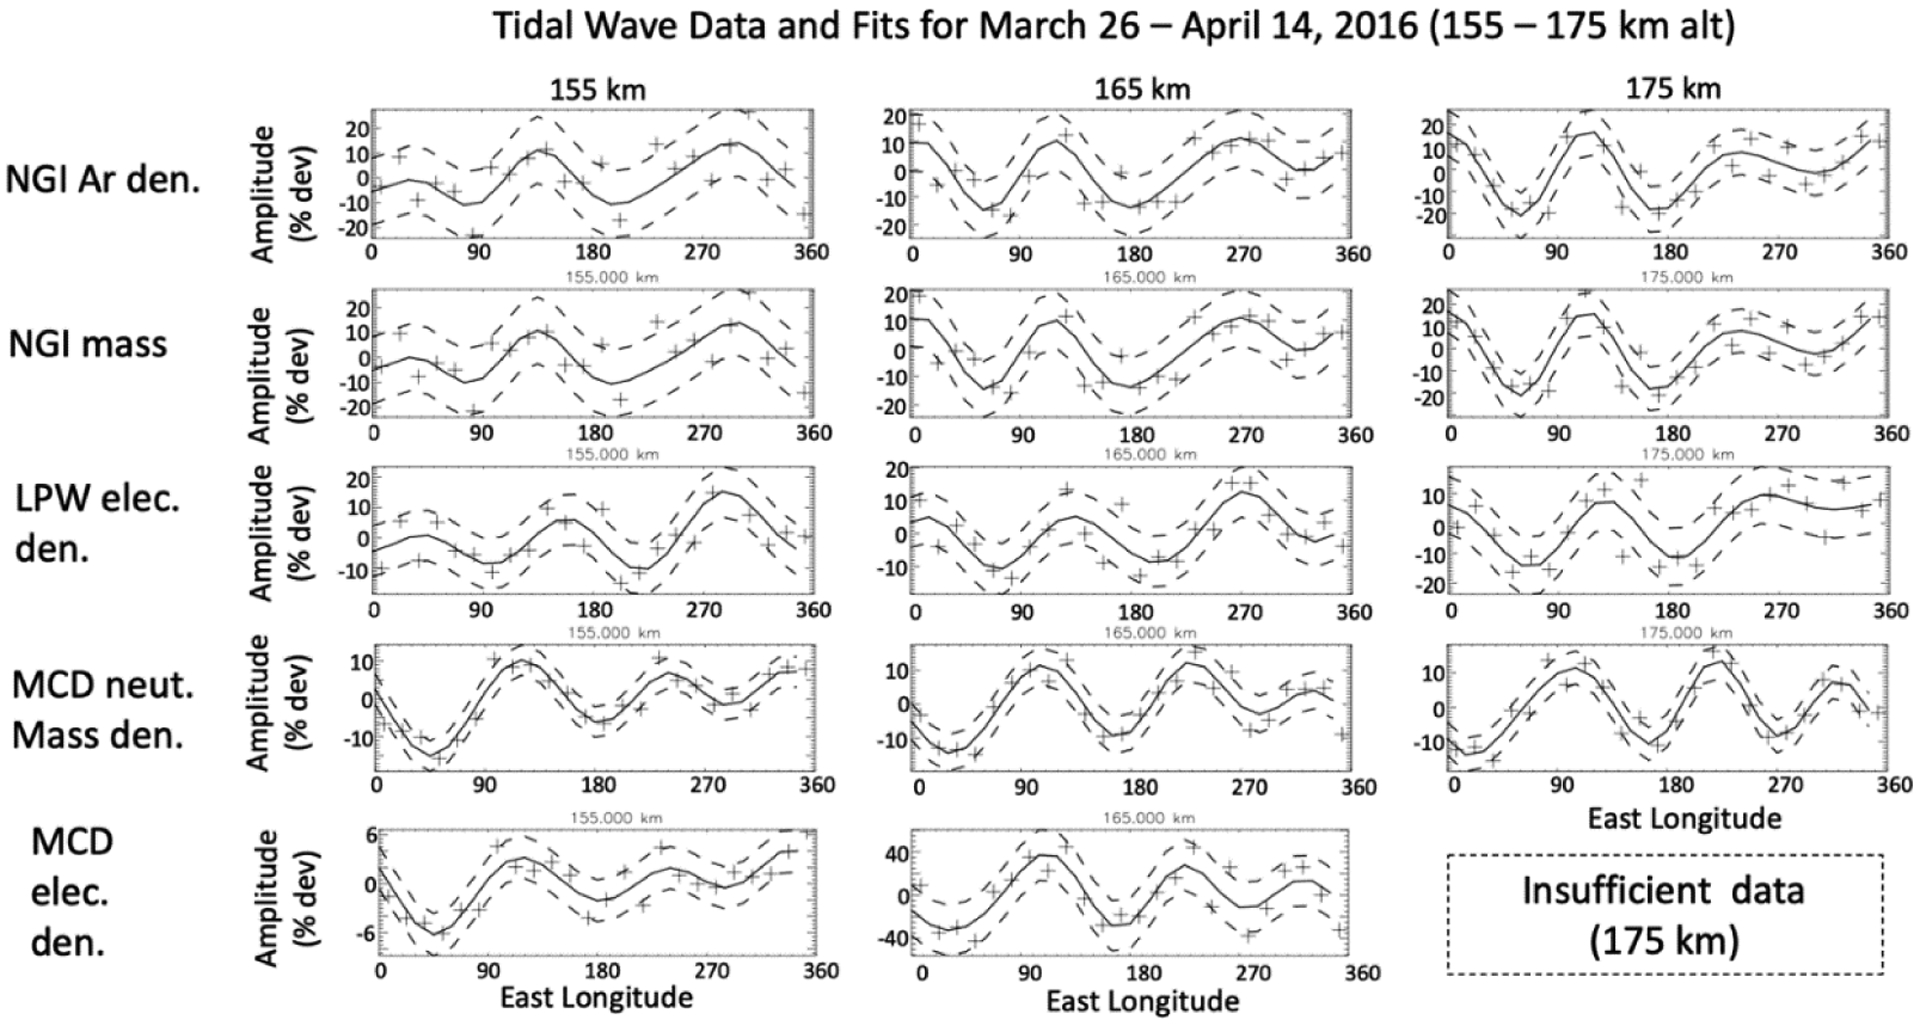
Tidal variations (+) taken from 155 km, 165 km, and 175 km in Figure 2, corresponding 4th order (wave-0 to wave-4) fits (solid line) and 1-sigma fit errors (dashed lines), in the neutral argon density (top row), neutral mass density (second row from top), ionospheric electron density (third row), MCD neutral mass density (fourth row) and MCD electron density (bottom row) for 20 days from 26 March to 14 April 2016. SLT ~18–13 h., SZA ~72–55°, LAT ~71–74° north, and Ls from ~125° to ~138°.