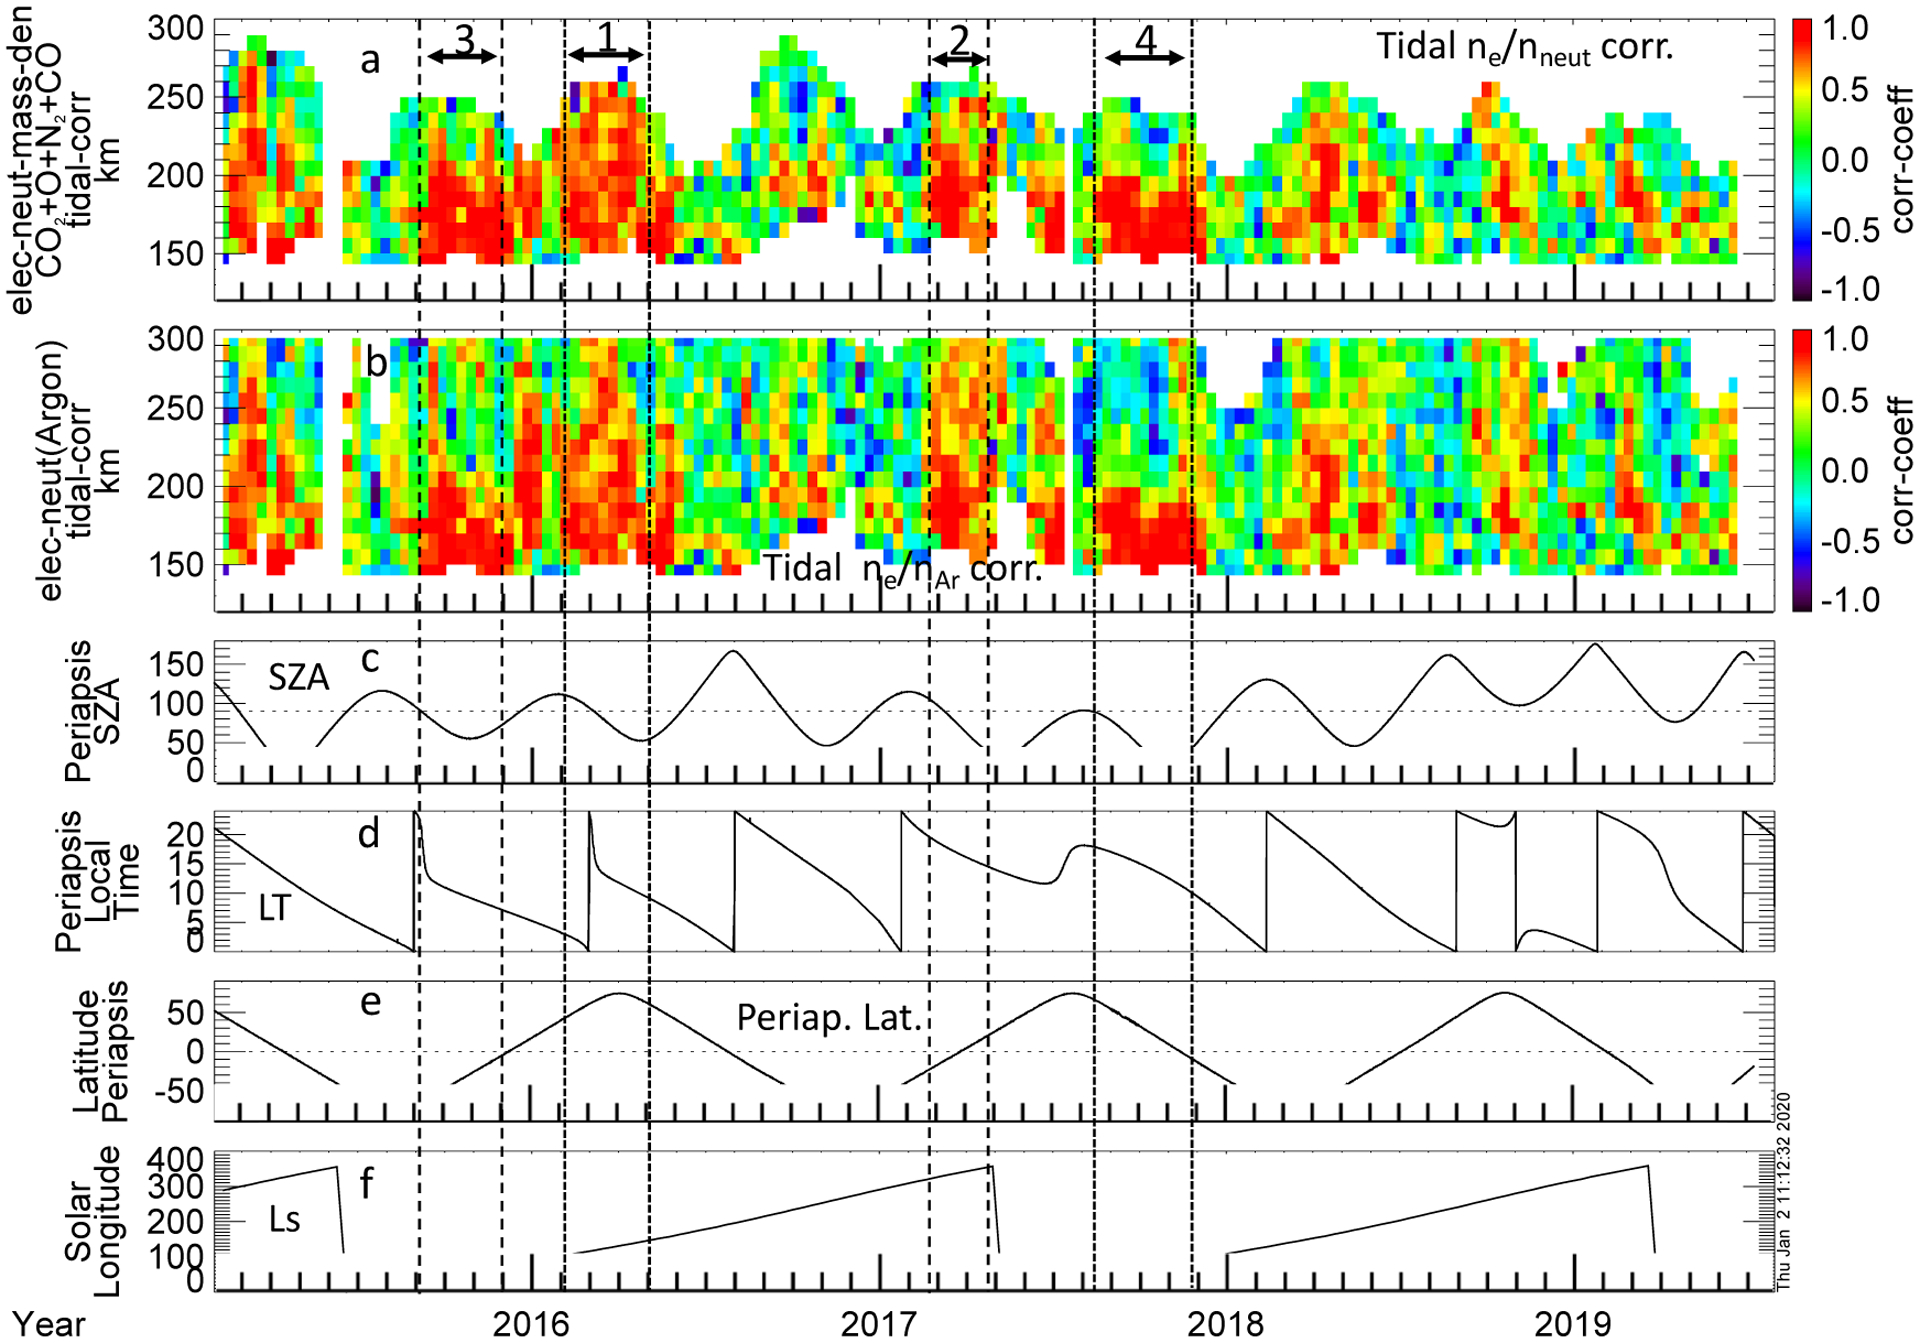
Figure 6.

Correlation coefficients between the fits of the tidal variations in the electron density and neutral mass density (a), and electron density and argon density (b), as a function of altitude and time for most of the MAVEN mission; February 2015–July 2019. Correlation coefficients greater than 0.41 or anti-correlations less than −0.41 are statistically significant. The solar zenith angle (c), local time (d), latitude (e), at periapsis, and solar longitude (f) are shown for context. The vertical pairs of lines along with the numbers at the top of panel (a) mark the four intervals which are described in Section 4.
