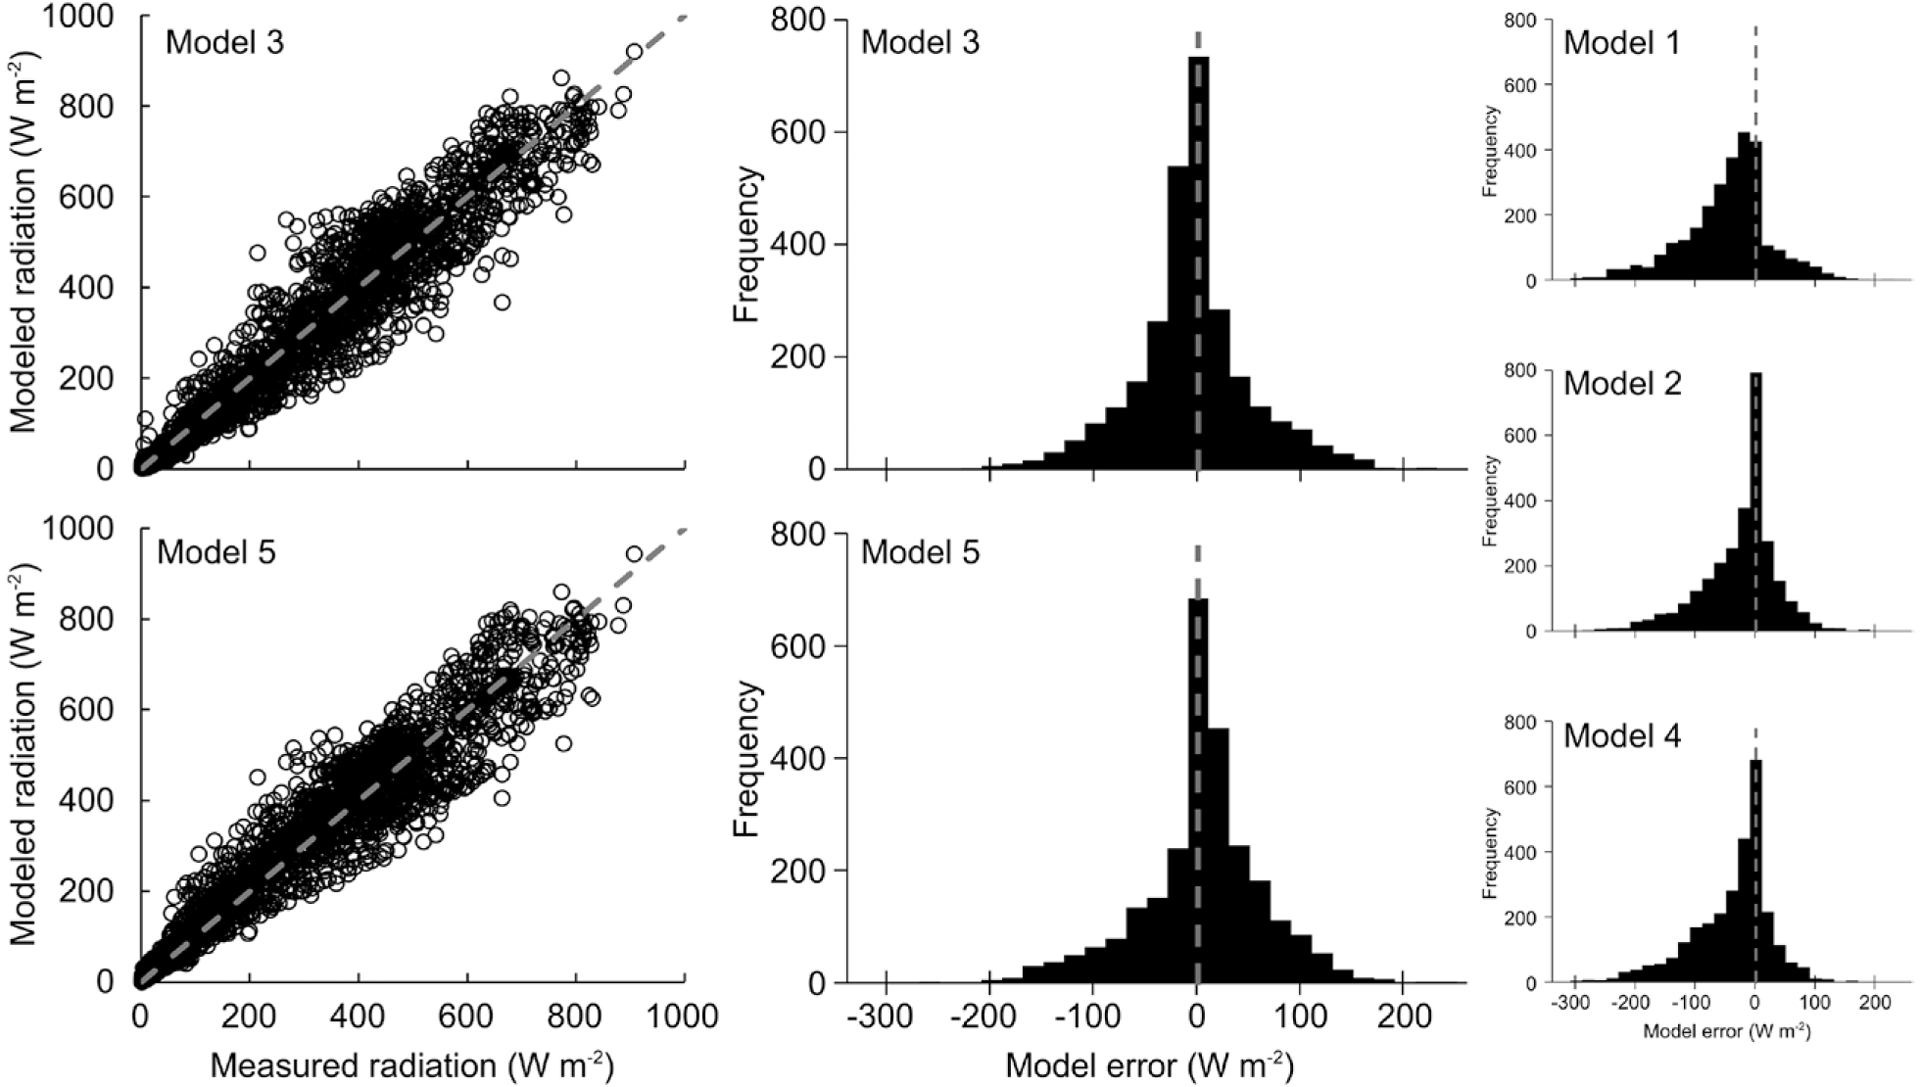
Fig. 12.

Comparison of solar radiation divergence model estimates with different levels of complexity (models 1–5) vs the below-vine-canopy solar radiation measurements (15-min averages). Error histograms for all the models indicate that the least bias and smallest error with the observations are from using models 3 and 5. Scatterplots for models 3 and 5 are provided with a dashed gray line indicating perfect agreement with observations (1:1 line).
