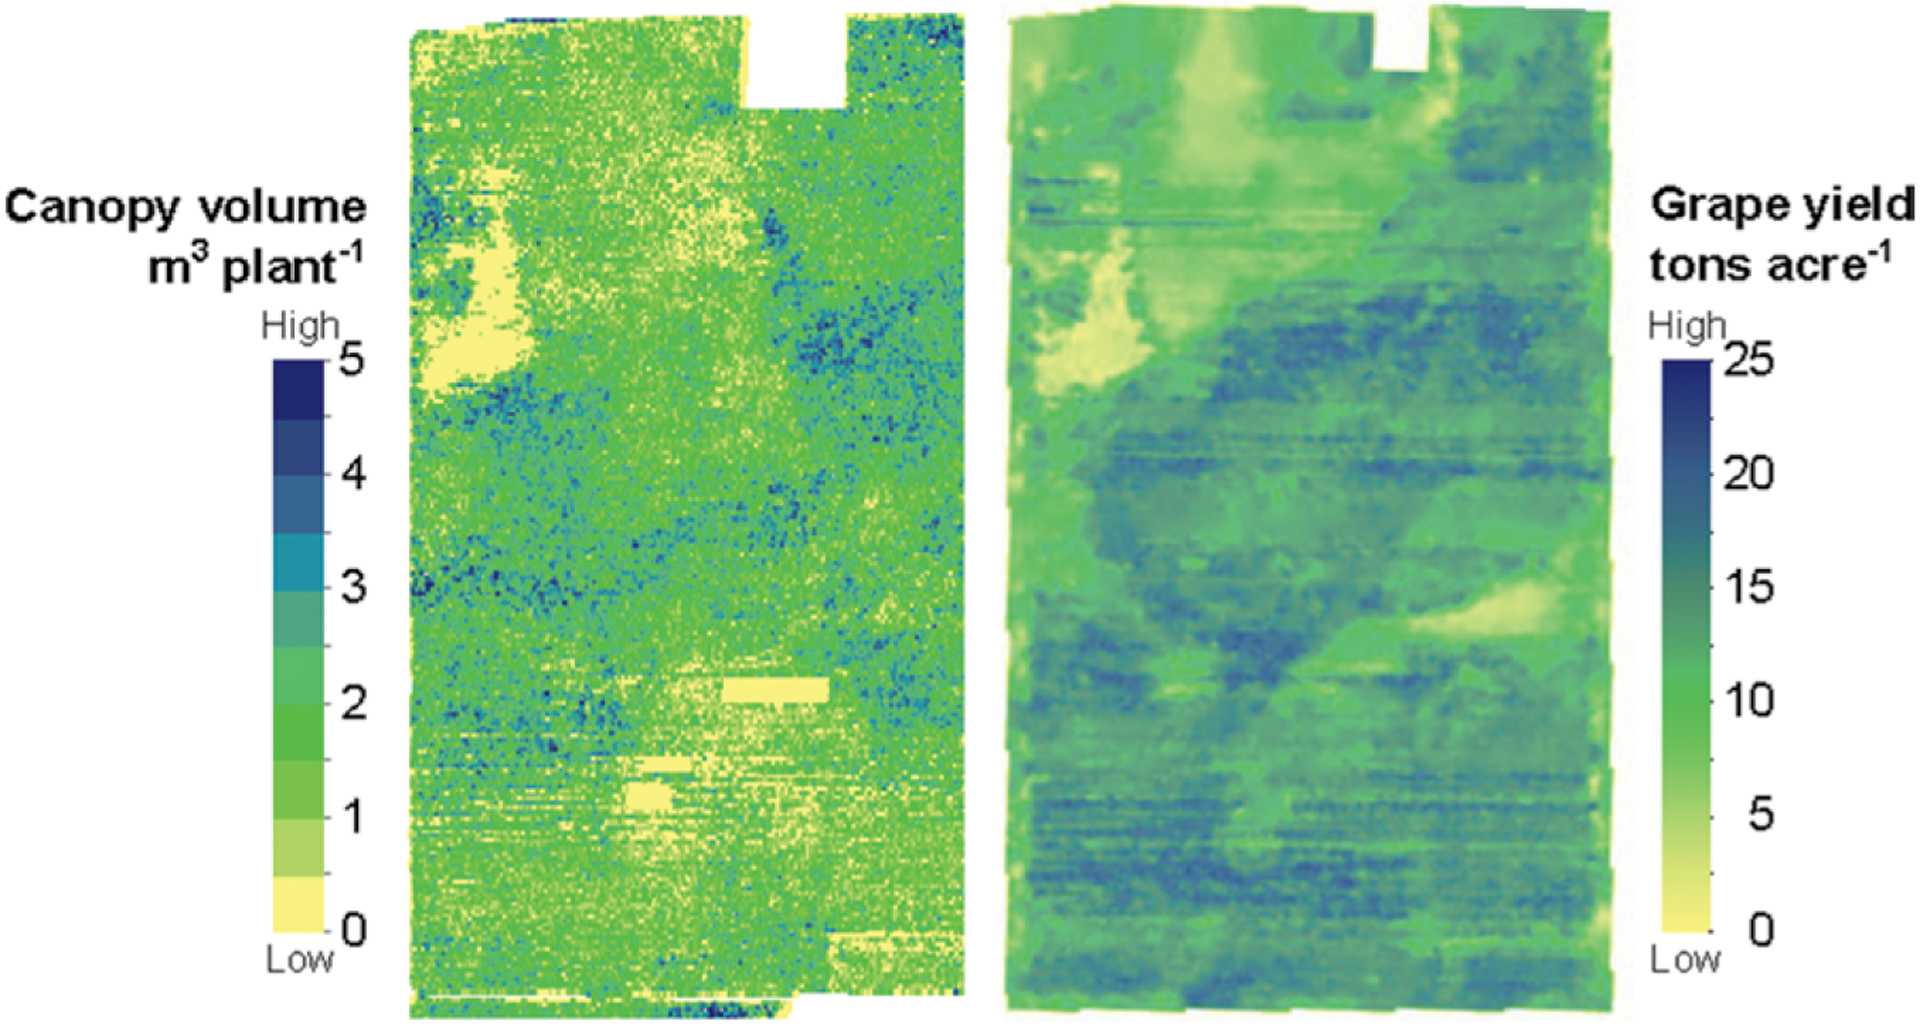
Fig. 14.

Example of (left) canopy volume estimated for individual vines for an AggieAir UAV flight in Aug 2014 and (right) the 2014 yield map for the north vineyard. Note the variability in canopy volume across the field and an area of highly stressed or dead vines in the upper left with little or no biomass.
