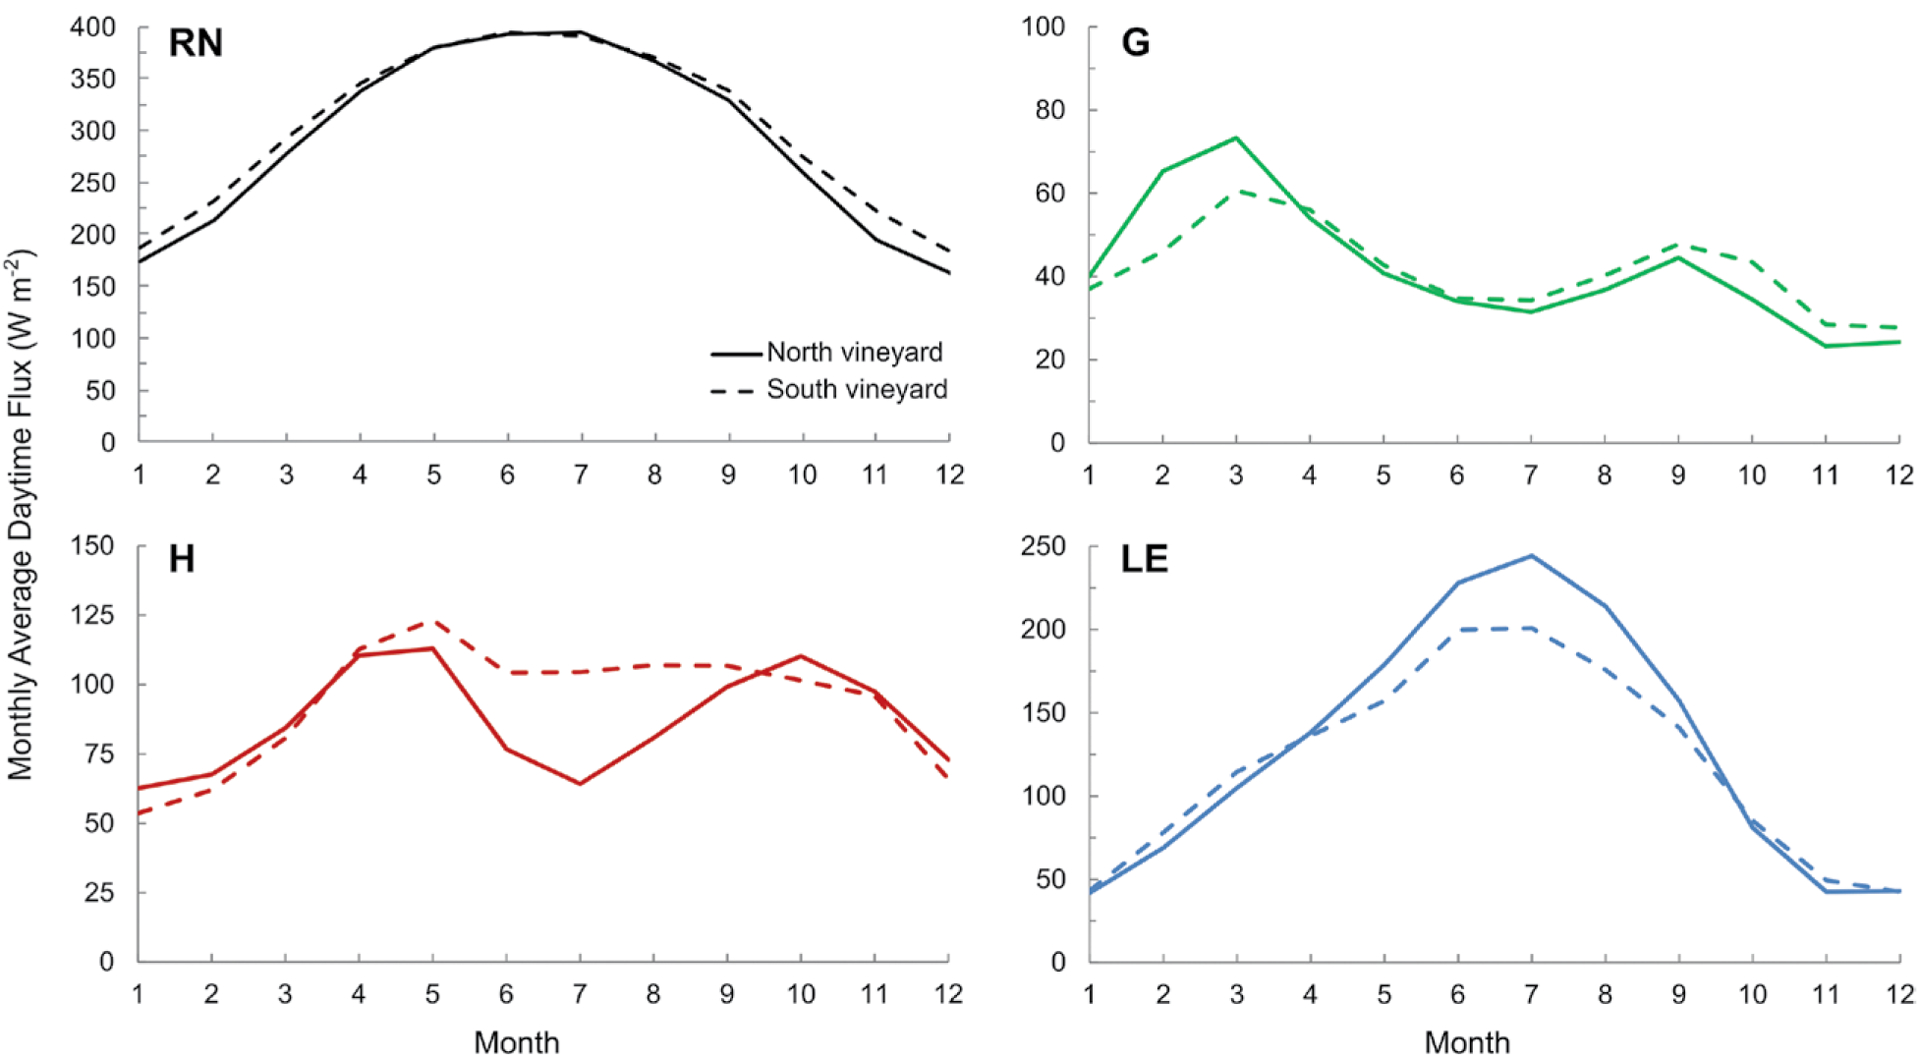
Fig. 6.

Daytime monthly average (mean of 2013–16) surface energy balance components: (top left) net radiation, (top right) soil heat flux, (bottom left) sensible heat flux, and (bottom right) latent heat flux for the north (site 1; solid line) and south (site 2; dashed line) vineyards.
