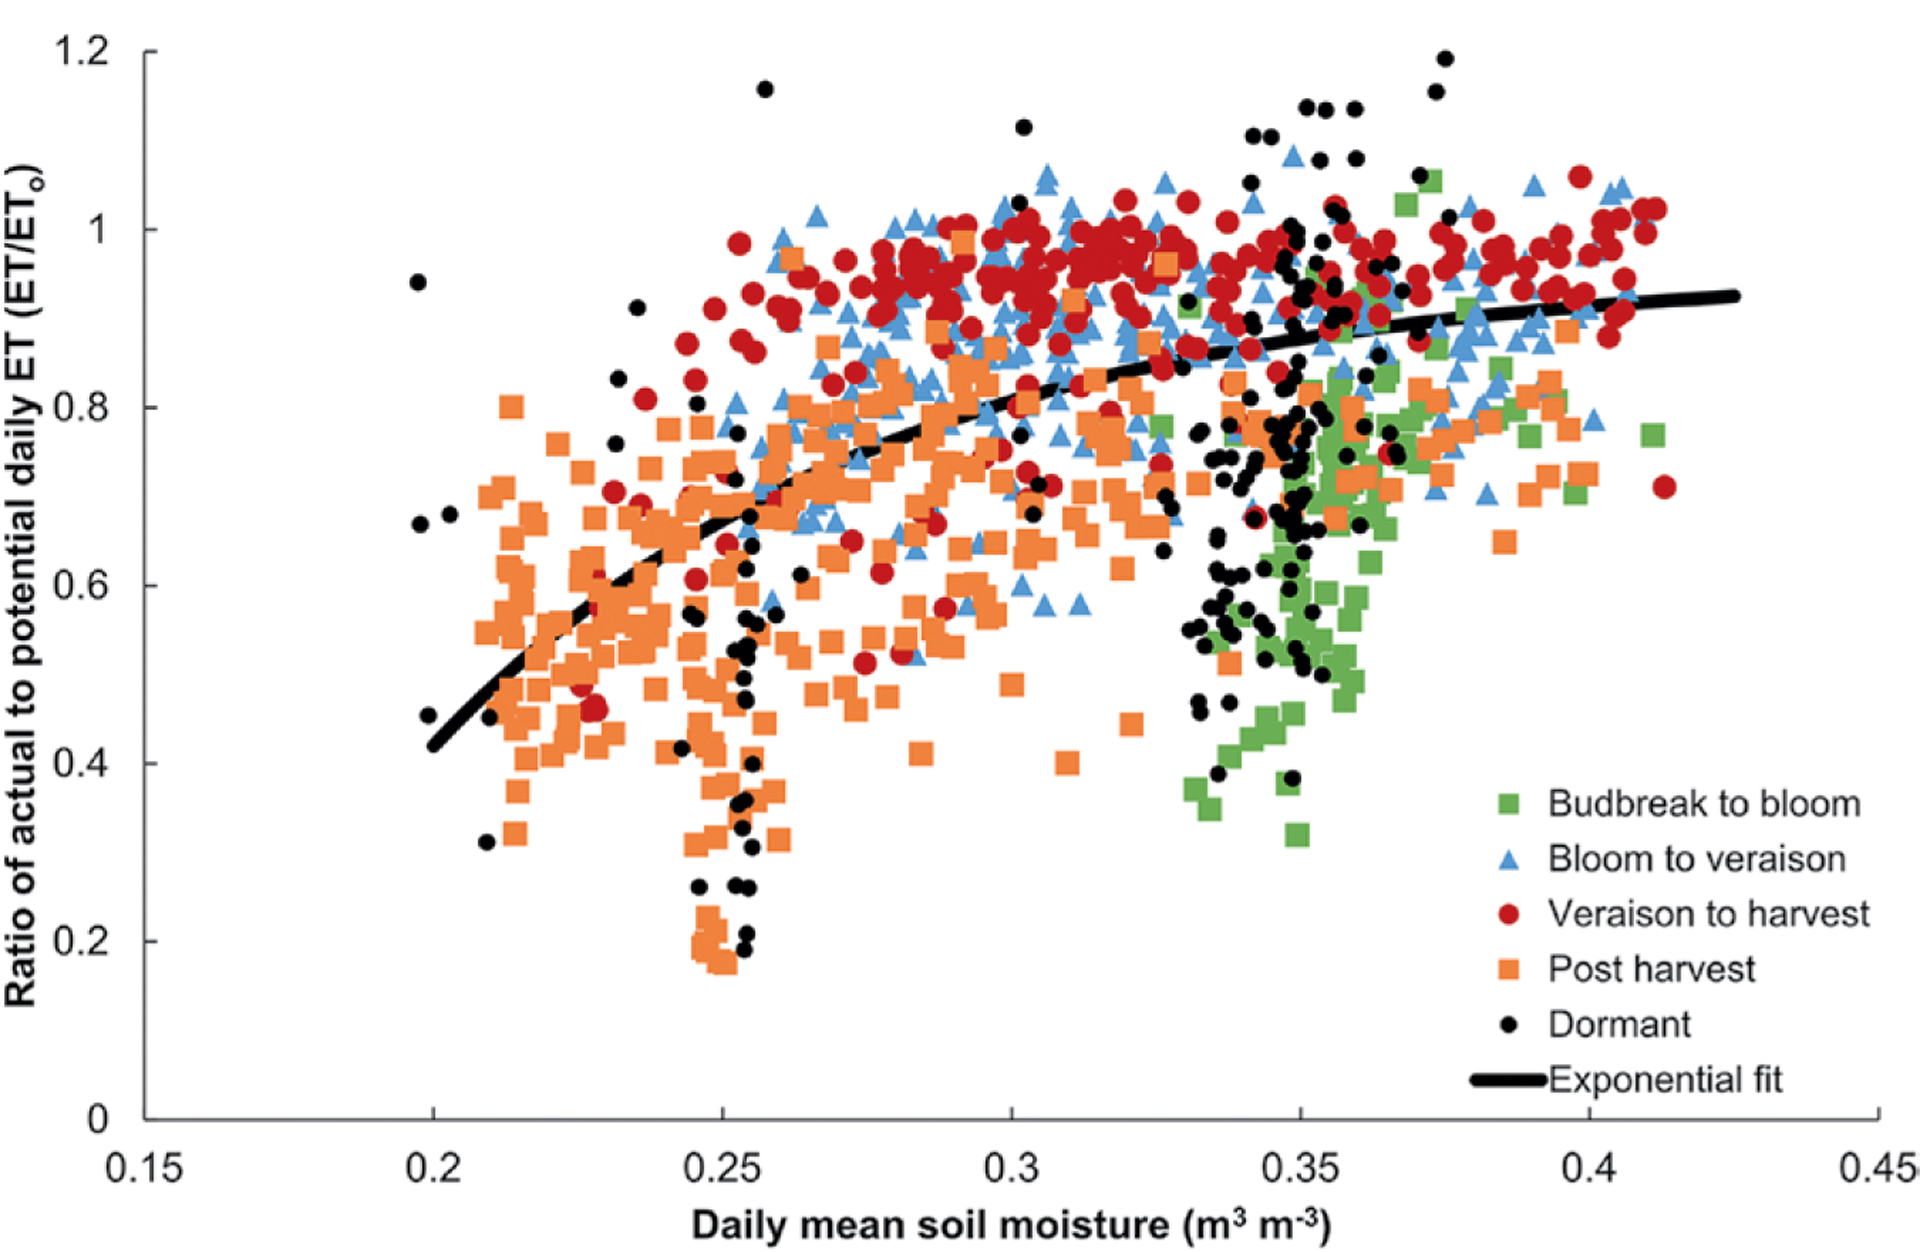
Fig. 8.

A comparison of profile average daily soil moisture vs ratio of actual to potential ET (ET/ETO) for 2013–16. The symbols represent data from different vine phenological stages. The curve is an exponential least squares fit through all the data.
