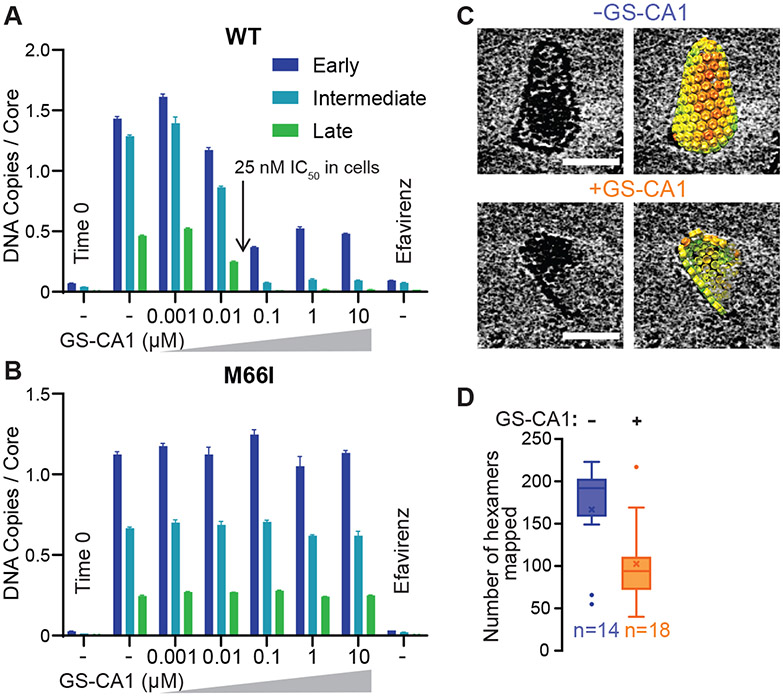
Fig. 3. Effects of the Capsid Inhibitor GS-CA1.
(A, B) ERT levels in the presence of different concentrations of GS-CA1, for cores containing WT (A) or a drug-resistant CA mutant M66I (B). Standard ERT conditions were used for these experiments. (C) Cryo-EM images of cores observed after 4 h under standard ERT conditions in the absence or presence of 100 nM GS-CA1. Scale bars, 50 nm. The capsid lattices are rendered as hexamer units, each colored by cross-correlation value as determined by sub-tomogram averaging, with red denoting low correlations. Full galleries are shown in Fig. S2. (D) Number of CA hexamers mapped per observable core in the absence or presence of 100 nM GS-CA1. Data are composite from two independent experiments that agreed well. Center lines show the medians, mean values are denoted by ×, box limits indicate the 25th and 75th percentiles, whiskers extend to minimum and maximum values, and circles indicate outliers, as determined in GraphPad Prism. Note that fully intact capsids contain an average of 240 hexamers.

