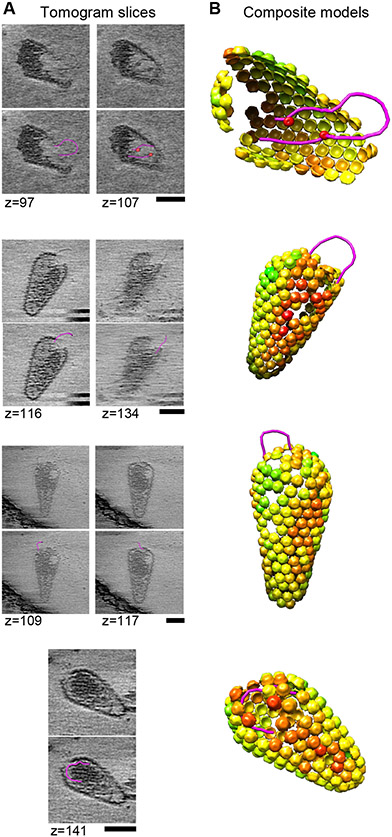
Fig. 4. Imaging Cores During Viral Replication.
(A) Tomographic slices of ruptured cores observed after 8-10 h under standard ERT conditions. Polynucleotide loops (magenta) were segmented using the tools in imod (58). Red spheres indicate apparent protein densities associated with the loops within the core. Scale bars, 50 nm. (B) Composite representations illustrating the three-dimensional arrangements of loops and capsid lattice maps. The capsid lattice maps are rendered as hexamer units, each colored by cross-correlation value as determined by sub-tomogram averaging, with red denoting low correlations.

