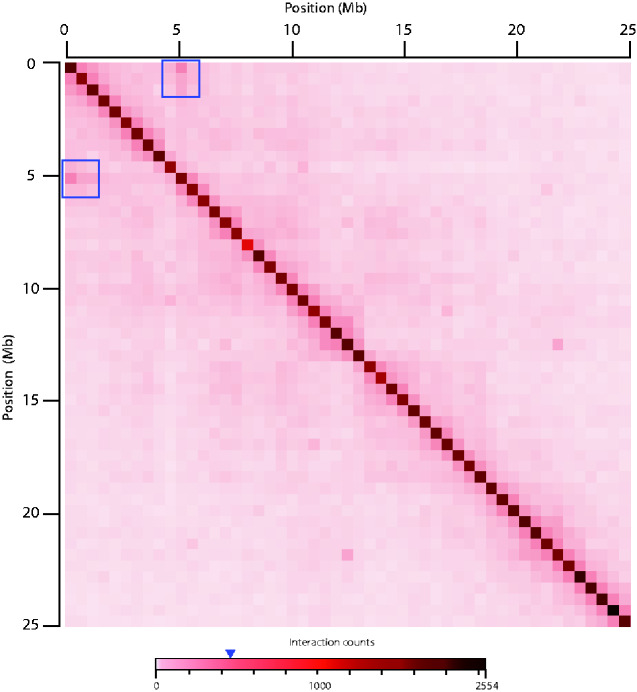
Figure 2.
Normalized linkage density heatmap of the first 25 Mb of chromosome 7 of S. tristichus. Bins of 500 kb were used. The heatmap is visualized as log2 ratios of observed interactions relative to expected interactions. Raw Hi-C sequence reads of HOL were mapped to SNOW. Blue squares indicate high interactions that are visible at the length reported for the inversion in this study (4.62MB). Interactions along the diagonal are the highest, as expected. The blue arrow indicates the approximate number of interaction counts at the inversion.

