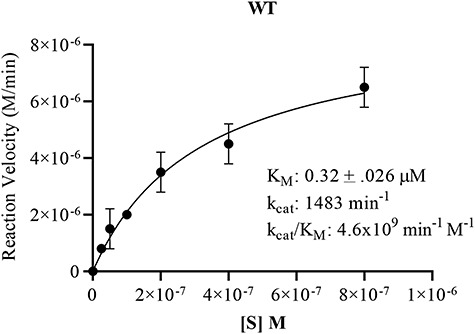
Fig. 3.

Substrate saturation curve for WT Pn3Pase. Michaelis–Menten kinetics were determined plotting substrate concentration against initial velocities for WT Pn3Pase. For kinetics experiments, WT received 1 μg/mL (5.97 nM) enzyme, respectively. Substrate concentrations were 800, 400, 200, 100, 50, 25 and 0 nM. Initial velocities were determined as the slope of the line in amount of product formed between 0 and 8 min. Amount product formed was determined using tetrasaccharide as standards. Kinetic parameters were determined using nonlinear regression (GraphPad Prism). Standard deviation of data was determined through independent duplicates.
