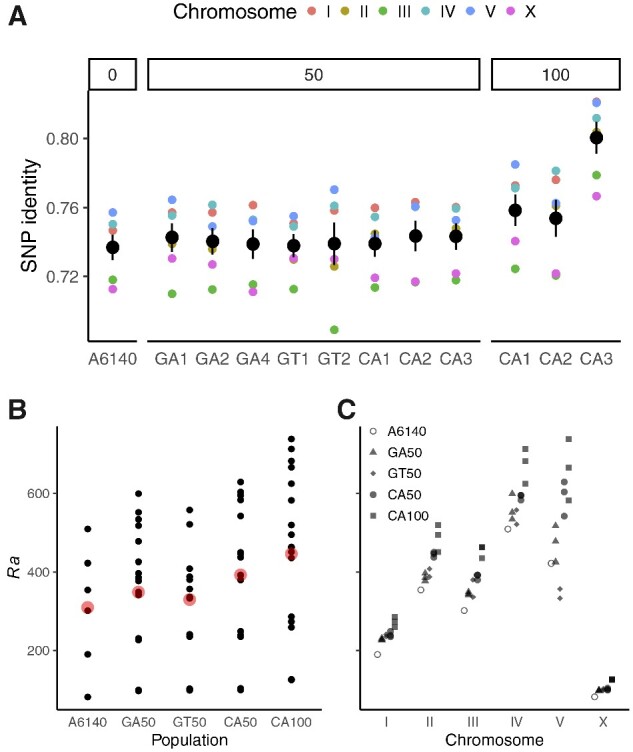
Figure 2.

(A) Genetic relatedness within population replicates, grouped by generation from A6140 (mean and standard error of pairwise identity among lines at segregating sites for each chromosome). (B–C) Realized map expansion across experimental populations (B) and chromosomes (C). Each point is a single value for a chromosome of each replicate population, with the grand mean overplotted in red in (B). Map expansion increases with generation ( by Poisson linear model), and for all chromosomes, though variably so (r2 > 0.77 for chromosomes other than V (0.58) and the outlying IV (0.37), the latter of which carries a very highly recombined haplotype within the right arm piRNA cluster (Chelo and Teotónio 2013; Noble et al. 2017).
