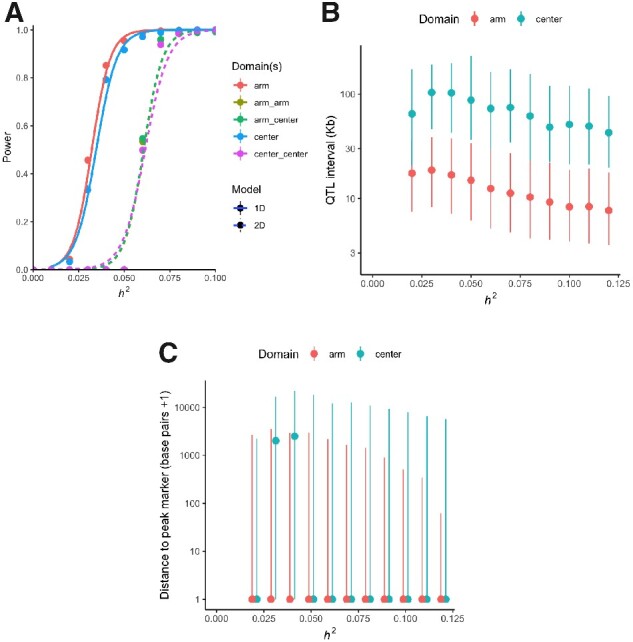
Figure 3.

(A) Detection power for additive (1D; single marker linear mixed-effects model) or interaction effects (2D; linear regression for a single marker pair), at 10% FDR based on the effective number of tests. Results (mean and standard error) are split by chromosome recombination rate domain(s) of the simulated site(s). (B) QTL detection intervals (median and interquartile range of markers within 1.5 LOD units of the peak marker) for the single-marker additive test. (C) Median and interquartile range for the distance of the true simulated site from the peak QTL marker. The x-axis shows simulated marker h2 (equivalently, r2).
