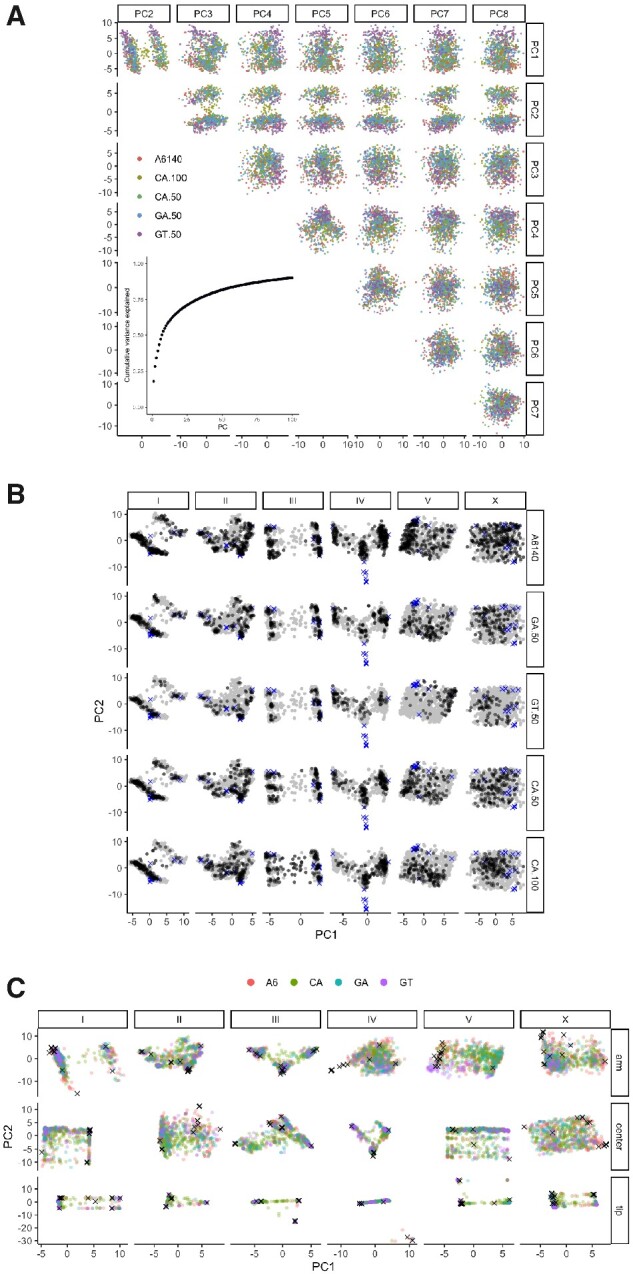
Figure 4.

Genetic structure is not dominated by experimental structure. (A) The first eight principal components (PCs) of the additive genetic relatedness matrix (accounting for almost half of the variance), colored by population. The inset shows the cumulative proportion of variance explained by the first 100 PCs. (B) Populations show relatively consistent structure, with the exception of chromosome V for GT populations due to introgression of a sex-determining allele. The top PCs for each chromosome are shown by experimental population (replicates combined). The full space occupied by populations (gray background points) and founders (× symbols) is shown across all panels. Variance explained for the populations ranges from 17% for chromosome X to 57% for IV. (C) As in B, with populations overplotted (CA50 and CA100 pooled), and stratified by recombination rate domain. All values are multiplied by 100.
