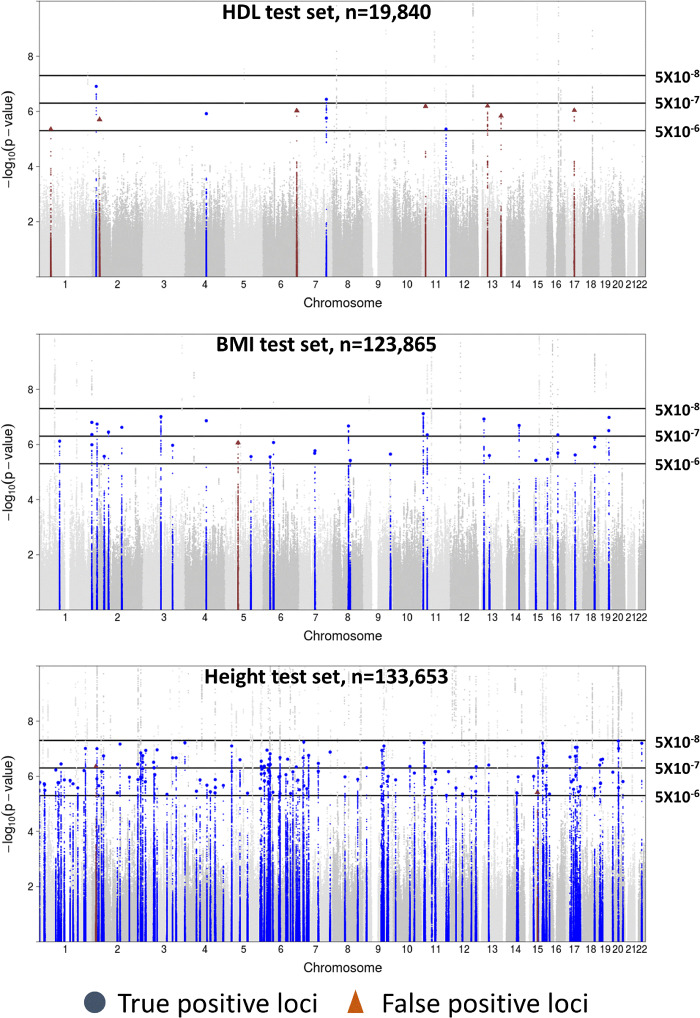
Figure 1.
Manhattan plot of empirical P-value thresholds for variants with P ≥ 5x10⁻⁸. Plots of different P-value thresholds applied to empirical test sets for HDL, BMI, and height. Colored variants depict true positive loci (blue) and false positive loci (red) for variants with P ≥ 5x10⁻⁸. Lead variants for true and false positive loci are represented by large blue circles and large triangles, respectively.

