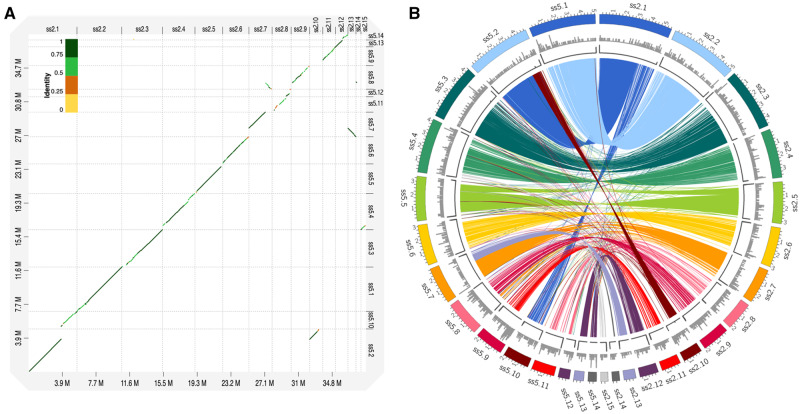
Figure 3.
Comparison between the assembled genomes of P. pulmonarius, strains ss2 and ss5. (A) Dot-plot alignment of ss5 (query) against ss2 (reference). (B) Correspondence between regions of high similarity (>95%, length >10 kb) among the most relevant scaffolds (>500 kb in size) of the two assembled genomes. Tracks (outer to inner) represent the distribution of genomic features in each assembly: (1) positions (in Mb) of the assembled scaffolds; (2) number of genes unique in each assembly (along 100-kb sliding windows, ranging between 0 and 35 genes); and (3) telomere repeat frequency (along 10-kb sliding window, ranging between 10 and 30 repeats).

