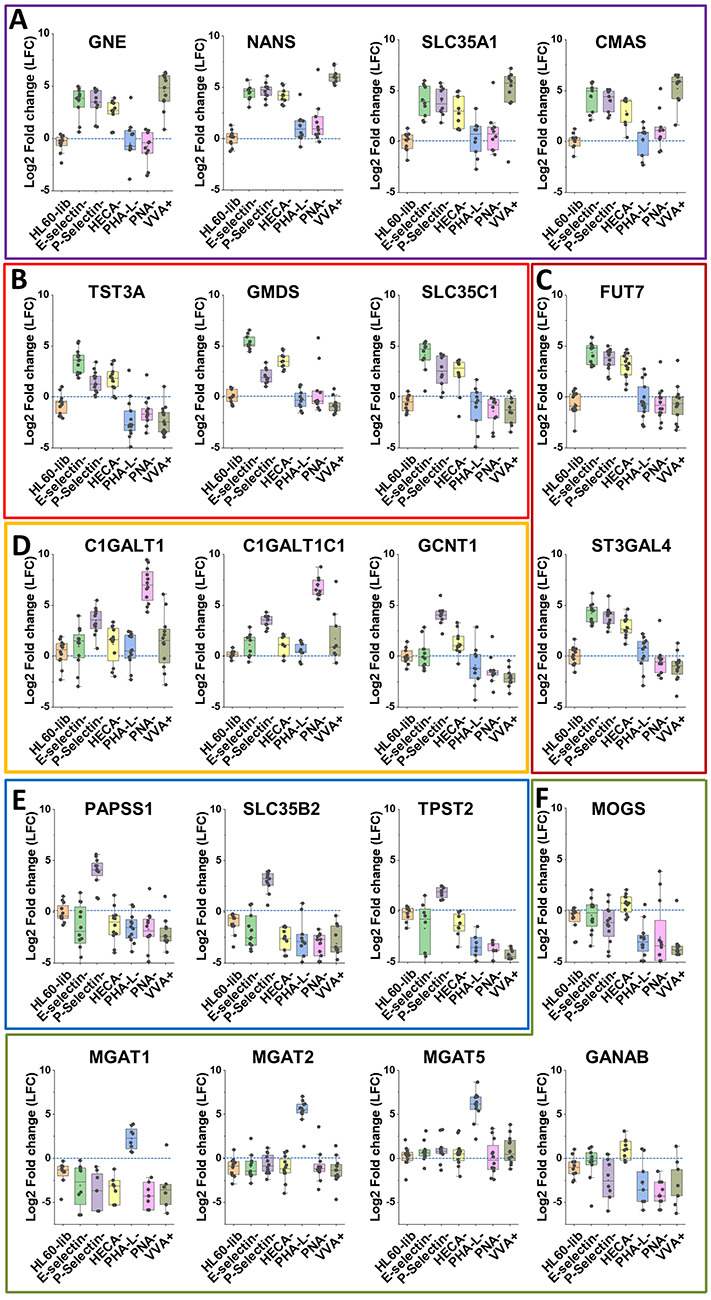
Fig. 3.

LFC analysis. Log2-fold change sgRNA data are presented for target gene vs. nontarget control for the unselected HL60-lib cells, and also the six lectin-selected cell types, i.e. LFC = log2[sgRNA count for target gene/sgRNA count for nontarget gene]. These data are presented for 20 different glycogenes that are involved in the following: A. CMP-sialic acid biosynthesis; B. GDP-fucose biosynthesis; C. α(1,3)fucosyltransferase FUT7 and α(2,3)sialyltransferase ST3Gal-4 activity; D. O-glycan construction; E. protein tyrosine sulfation; and F. N-glycan elaboration. Each dot represents one sgRNA. Enriched sgRNA display LFC > 0. Unaffected sgRNA have LFC ≤ 0, similar to the HL60-lib control. (This figure is available in black and white in print and in color at Glycobiology online)
