Figure 1.
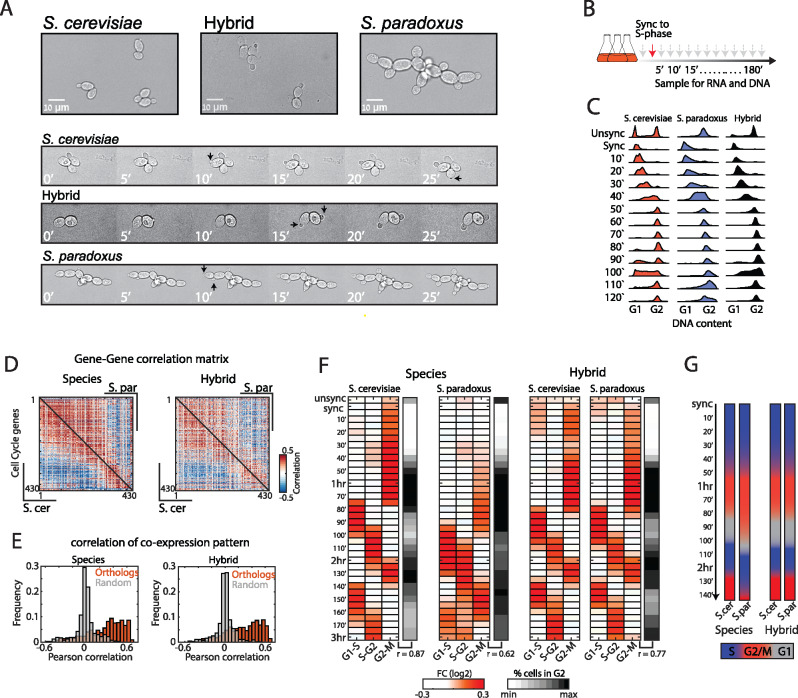
Trans-dominant expression program follows the growth pattern. (A) Microscopy images of S. cerevisiae, S. paradoxus, and their hybrid grown on YPD. Saccharomyces cerevisiae display bipolar budding and G1 daughter cell delay. Saccharomyces paradoxus displays unipolar and synchronized budding and remains attached after cytokinesis. The hybrid grows like S. cerevisiae, while exhibiting a short daughter-delay. Black arrows mark new buds. (B) Experimental layout: Cells were synchronized to early S-phase using HU, washed, and sampled for transcriptional profiling and DNA staining for 3 h in 5-min intervals. (C) Synchronized progression was monitored by measuring the DNA content using flow-cytometry (full profiles are shown in Supplementary Figure S1A). (D) Co-expression of cycling genes is conserved between species. Shown are gene–gene correlation matrices (Pearson) of periodic genes ordered by their expression peak along the cell cycle (Santos et al. 2015), S. cerevisiae is shown in the lower triangle and S. paradoxus in the top triangle. (E) Histograms showing the distributions of co-expression correlation coefficients between orthologous genes and between random pairs. (F) Periodicity of gene expression is synchronized with cell cycle transitions. Shown are the average fold changes of periodic genes (relative to median) classified to three groups based on expression time [defined in Santos et al. (2015)]. Black panel indicates percentage of cells in G2-M by DNA content profiles. Correlation values in bottom indicate the Pearson correlation coefficient between expression of the G2-M module to percent cells in G2-M by DNA content. (G) Differences in cell cycle phase dynamics: Shown is the duration of the cell cycle phases along the experiment based on (F).

