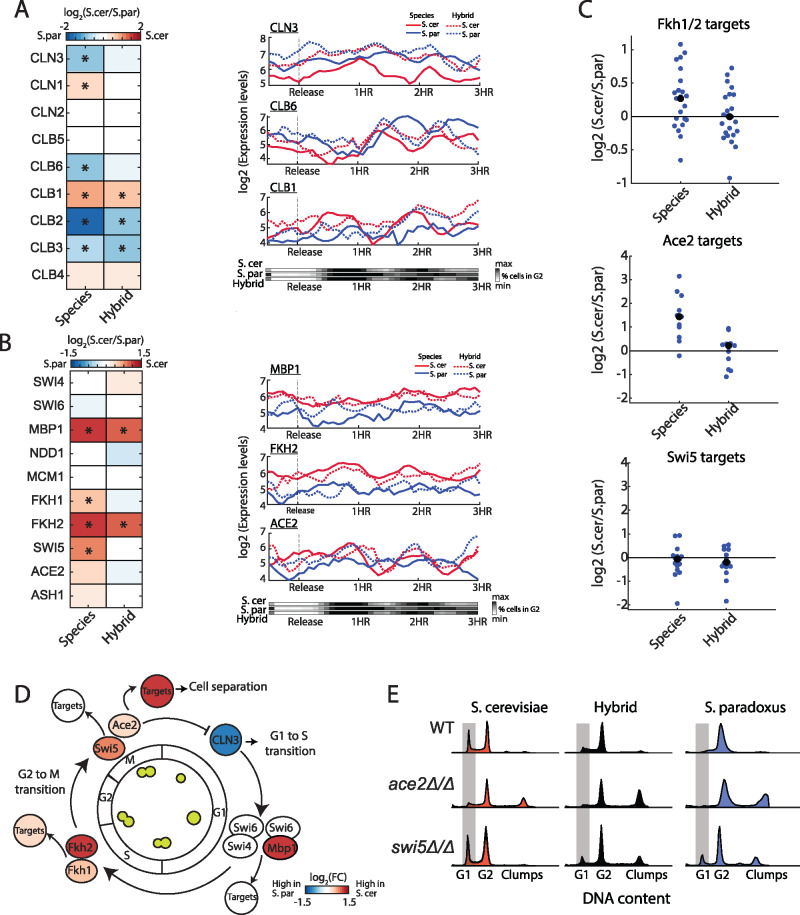
Figure 2.
Cell cycle regulators accumulated regulatory variations that bias expression in support of the respective phenotype (A) Expression of cyclins. Left: gene expression differences between the species and between hybrid alleles. Presented fold change values are: log2(reads in S. cerevisiae/reads in S. paradoxus). Genes ordered by their expression time along the cell cycle. Asterisk marks significant difference in expression (corrected P-value < 0.05 and log2FC > 0.5). Right: Gene expression levels for example genes: CLN3 (early G1), CLB6 (early S), and CLB1 (G2) along the cell cycle, in synchrony with changes in DNA content (bottom panel). (B) Expression of cell cycle TFs, same as in (A). (C) log2 FC in TFs target genes: Fkh1/2 (Zhu et al. 2000), Ace2 (Voth et al. 2007), and Swi5 (Voth et al. 2007). Black dots indicate the group’s mean. Targets defined by MacIsaac et al. (2006) are shown in Supplementary Figure S2A. Ace2 targets are shown in detail in Supplementary Figure S2B (D) Divergence in cell cycle regulators. A scheme of cell cycle regulation, color indicates inter-species expression differences. (E) DNA contents profiles of WT, ace2Δ/Δ and swi5Δ/Δ, in both species and hybrid, taken during exponential growth in YPD. Grey area marks cells in G1 phase.

