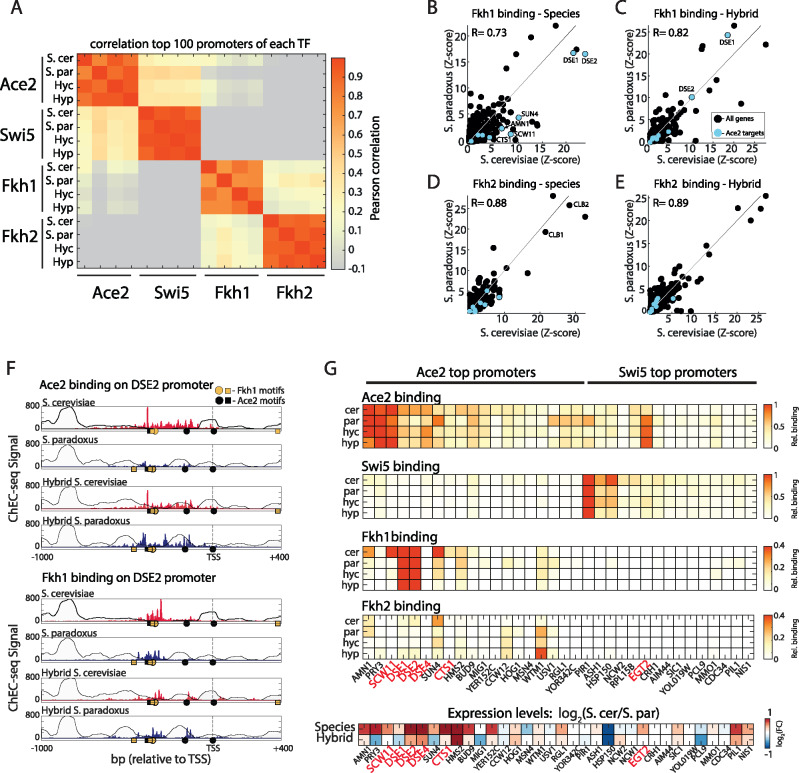
Figure 4.
Divergence in binding of Fkh1 and Fkh2 on Ace2 targets (A) Pearson correlation matrix between the top 100 promoters of Ace2, Swi5, Fkh1, and Fkh2. Hyc and Hyp refer to Hybrid S. cerevisiae genome and S. paradoxus genome, respectively. Note that Fkh1 shows low-positive correlation with S. cerevisiae Ace2. (B–E) Binding profiles of Fkh1 and Fkh2 between species and within the hybrid, same as Figure 3B, marked in blue are Ace2 targets (Voth et al. 2007). (F) Binding of Ace2 and Fkh1 on the cell-separation gene DSE2. Circles and squares represent Ace2 binding motif (CCAGC, black), and Fkh1 binding motif (GTAAACA, yellow) on + and − strand, respectively. Note trans-effects both in Ace2 and in Fkh1. (G) Binding on the top promoters of Ace2 and Swi5. Top: Shown are relative sum of signal on promoters for each factor in the species and hybrid. Note overlap of Fkh1 and Fkh2 with Ace2 promoters. Bottom: Differences in expression levels. Cell-separation genes are marked in red.

