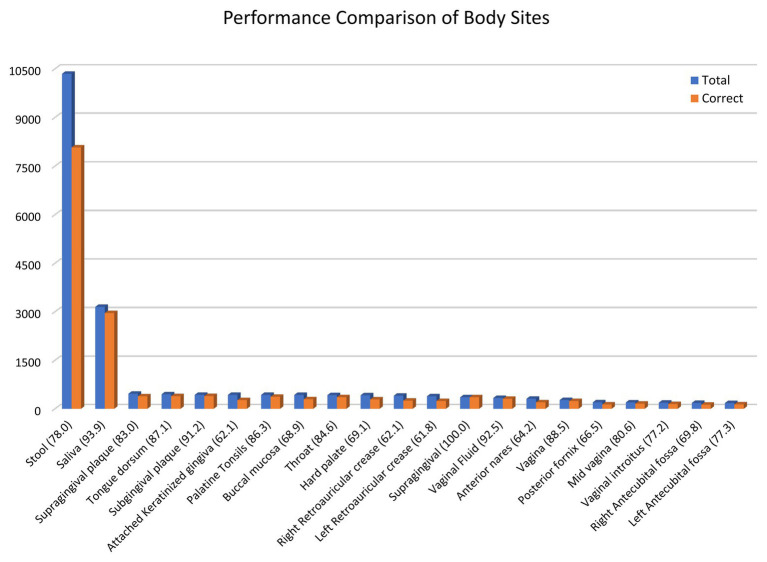
Figure 5.
Similarity-based prediction performance of different body sites. A leave-one-out cross-validation of the data was performed using a similarity-based prediction approach. The results for body sites with more than 150 samples are shown. The bar graph shows the total number of samples for a body site and the number of samples with correct geolocation prediction.

