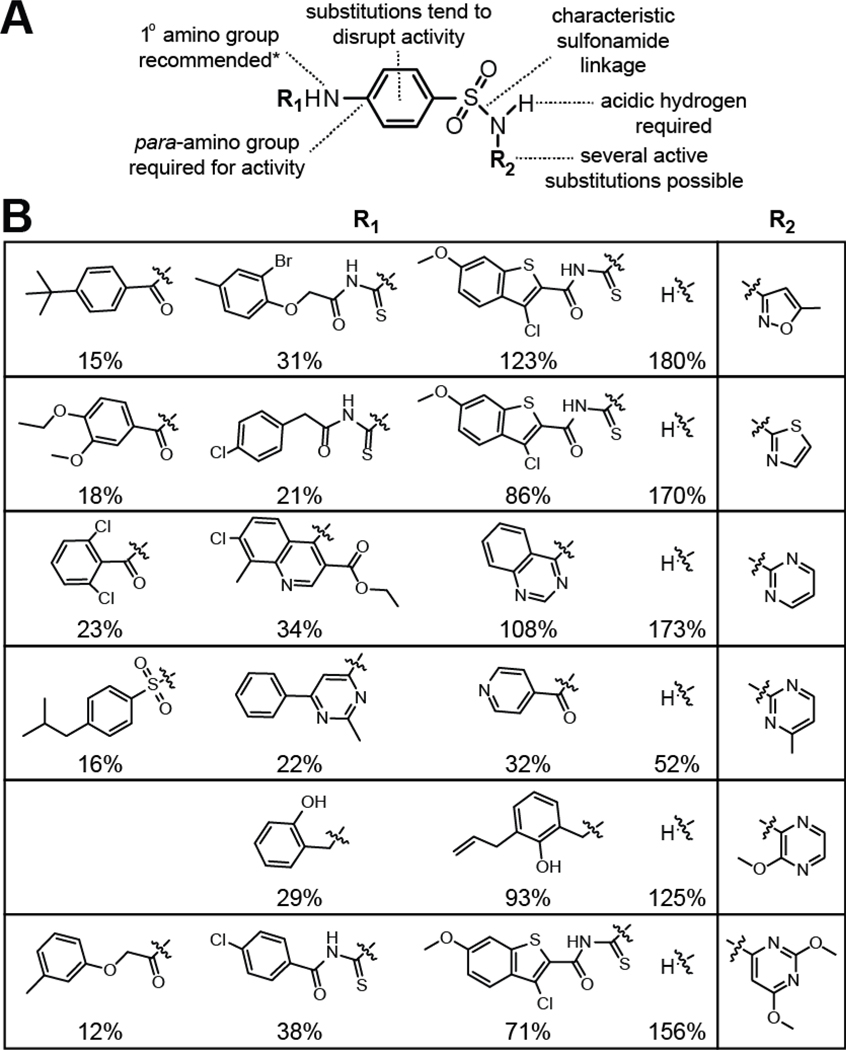
Figure 4. Summary of the Key Features of Sulfanilamide Antifolate Compounds.
(A) Schematic representation of the pharmacophore for sulfanilamide antibacterial agents (Hong et al., 1995; Maren, 1976). Note that the prefered R1 group is a single hydrogen, but this position can tolerate substitutions in the form of prodrugs, where removal of the R1 group to create a primary amine best mimics the PABA moiety to yield the active agent.
(B) SAR for representative sulfanilamide derivatives from the final list of validated HTS hits. Percentages reflect the average reporter gene expression values for various hits compared to trimethoprim (100%), and were established with the WT reporter strain using assays conducted in triplicate with 10 μM of each compound. The chemical moiety in the R2 column was held constant for the R1 moieties presented in each row.

