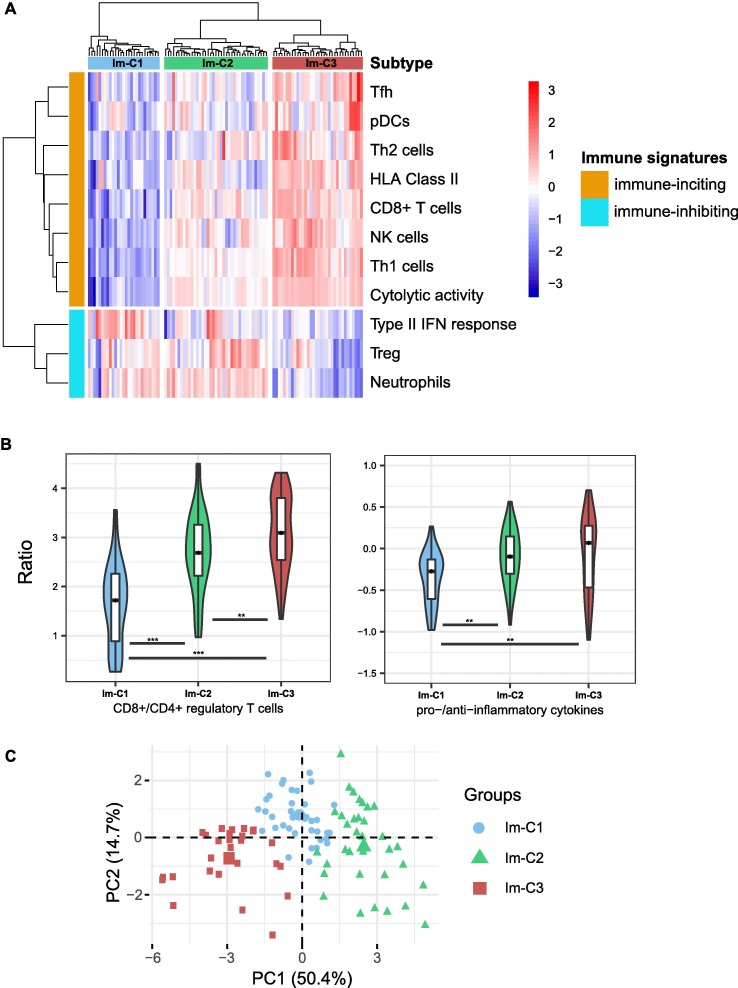
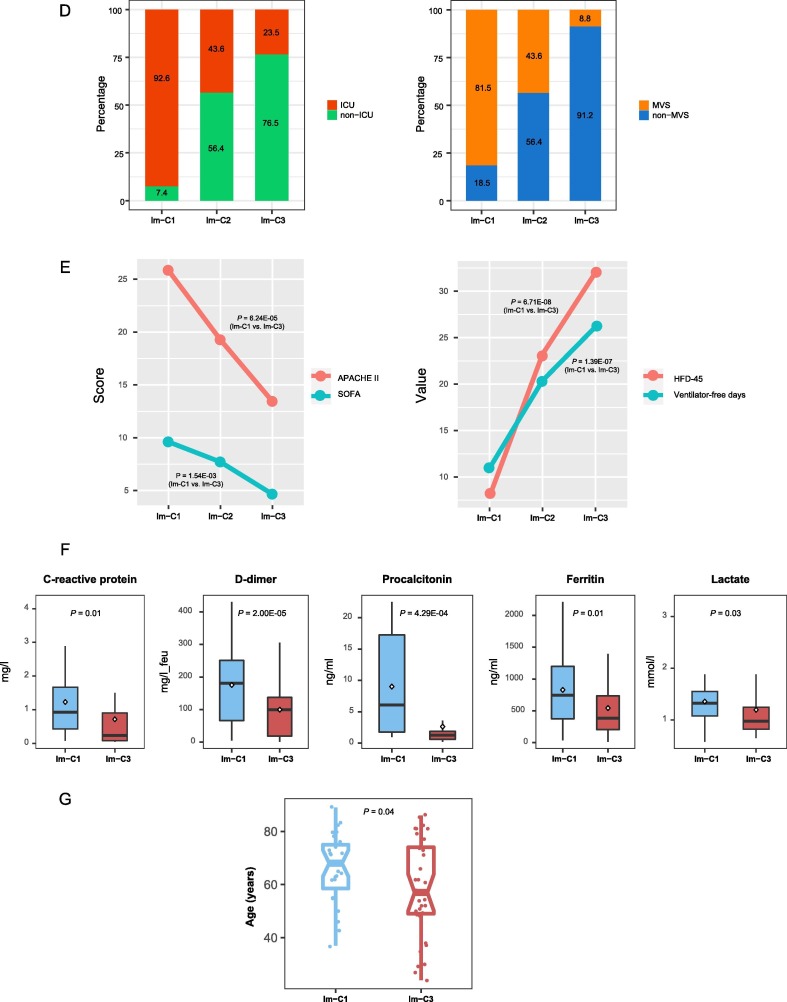
Fig. 1.
Identification of COVID-19 immune subtypes. A. Hierarchical clustering of 100 COVID-19 patients based on the enrichment scores of 11 immune signatures in leukocytes. B. Comparisons of the ratios of immune-stimulatory to immune-inhibitory signatures between the three COVID-19 subtypes. The ratios were the mean expression levels of the marker genes of immune-stimulatory signatures over those of immune-inhibitory signatures (log2-transformed). The Student’s t test P-values are indicated. * P < 0.05, ** P < 0.01, *** P < 0.001 (This also applies to the following figures). C. Principal component analysis confirming that COVID-19 can be divided into three subgroups based on the enrichment scores of the 11 immune signatures. D. Proportions of COVID-19 patients admitted to intensive care unit (ICU) or requiring mechanical ventilatory support (MVS) in the COVID-19 subtypes. E. Comparisons of the scores of the Acute Physiology and Chronic Health Evaluation (APACHE II) and the Sequential Organ Failure Assessment (SOFA), ventilator-free days, and the hospital-free days at day 45 (HFD-45) values between the three COVID-19 subtypes. F. Comparisons of the COVID-19 severity-associated laboratory measurements between COVID-19 subtypes. G. Comparisons of the age between COVID-19 subtypes. The one-tailed Mann–Whitney U test P-values are shown.


