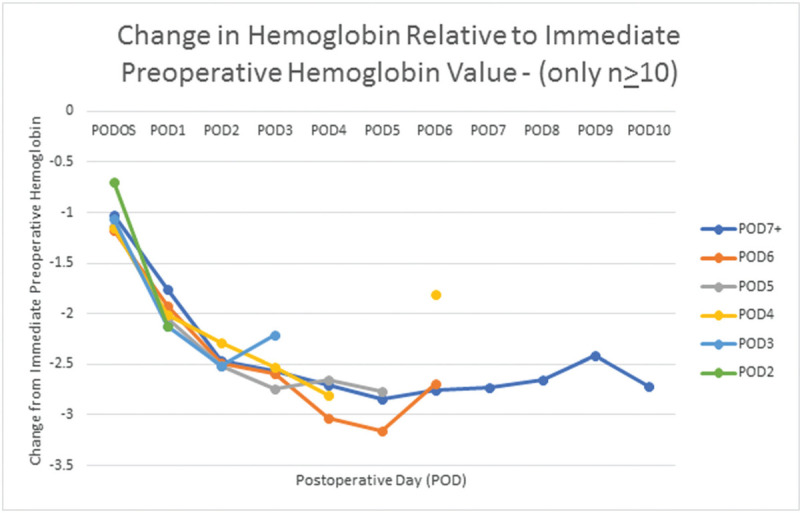
Figure 2.

Graph depicts change in Hgb relative to immediate preoperative Hgb value for patients grouped by postoperative discharge date. Patients who were discharged on postoperative day 3 showed a trend toward an increase on that day, but available data shows that average Hgb of patients who were not discharged on postoperative day 3 had an overall progressive decline in Hgb for 5 days. (Postdischarge data is included when available. Points with fewer than 10 recordings were removed in order to simplify the graph).
