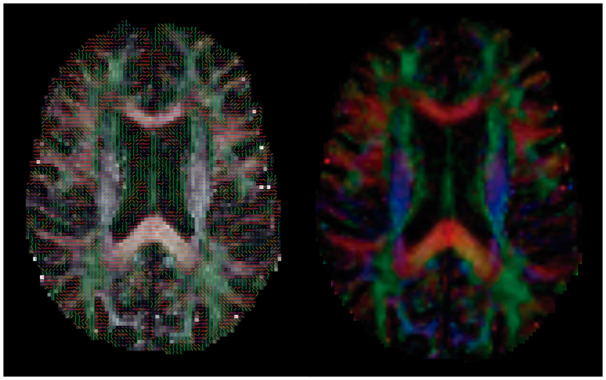
FIGURE 1.

Fractional anisotropy. The picture on the right shows a slice of the fractional anisotropy map of a single subject with an overlay of the first eigenvector. The picture on the left represents a slice of the coloured fractional anisotropy map for the same subject. The colour indicates the direction of the fibres in each voxel (red: left–right; green: anterior–posterior; blue: superior–inferior).
