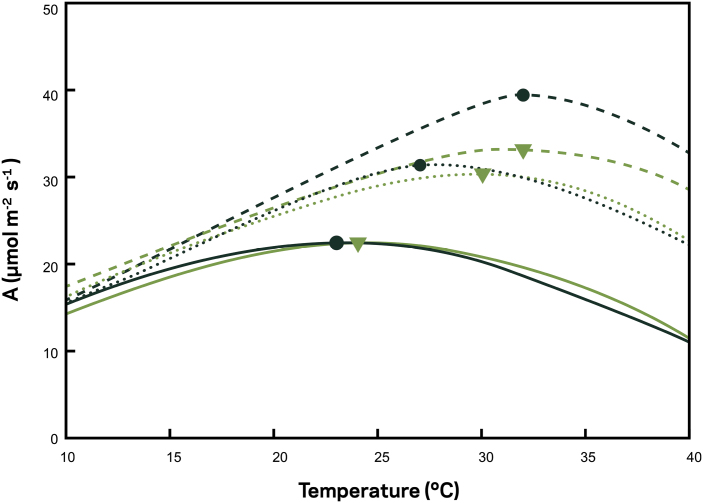
Fig. 3.
Temperature response of C3 leaf photosynthesis (μmol m–2 s–1) modelled at atmospheric [CO2] of 400 (solid lines), 600 (dotted lined), and 800 (dashed lines) μmol mol-–1. Model parameters were taken from Bernacchi et al. (2001, 2003, black circles) and Long (1991, green triangles), with the symbol location on the curve representing the temperature optimum for each photosynthetic response curve. The figure has been redrawn from Bagley et al. (2015), with permission.

