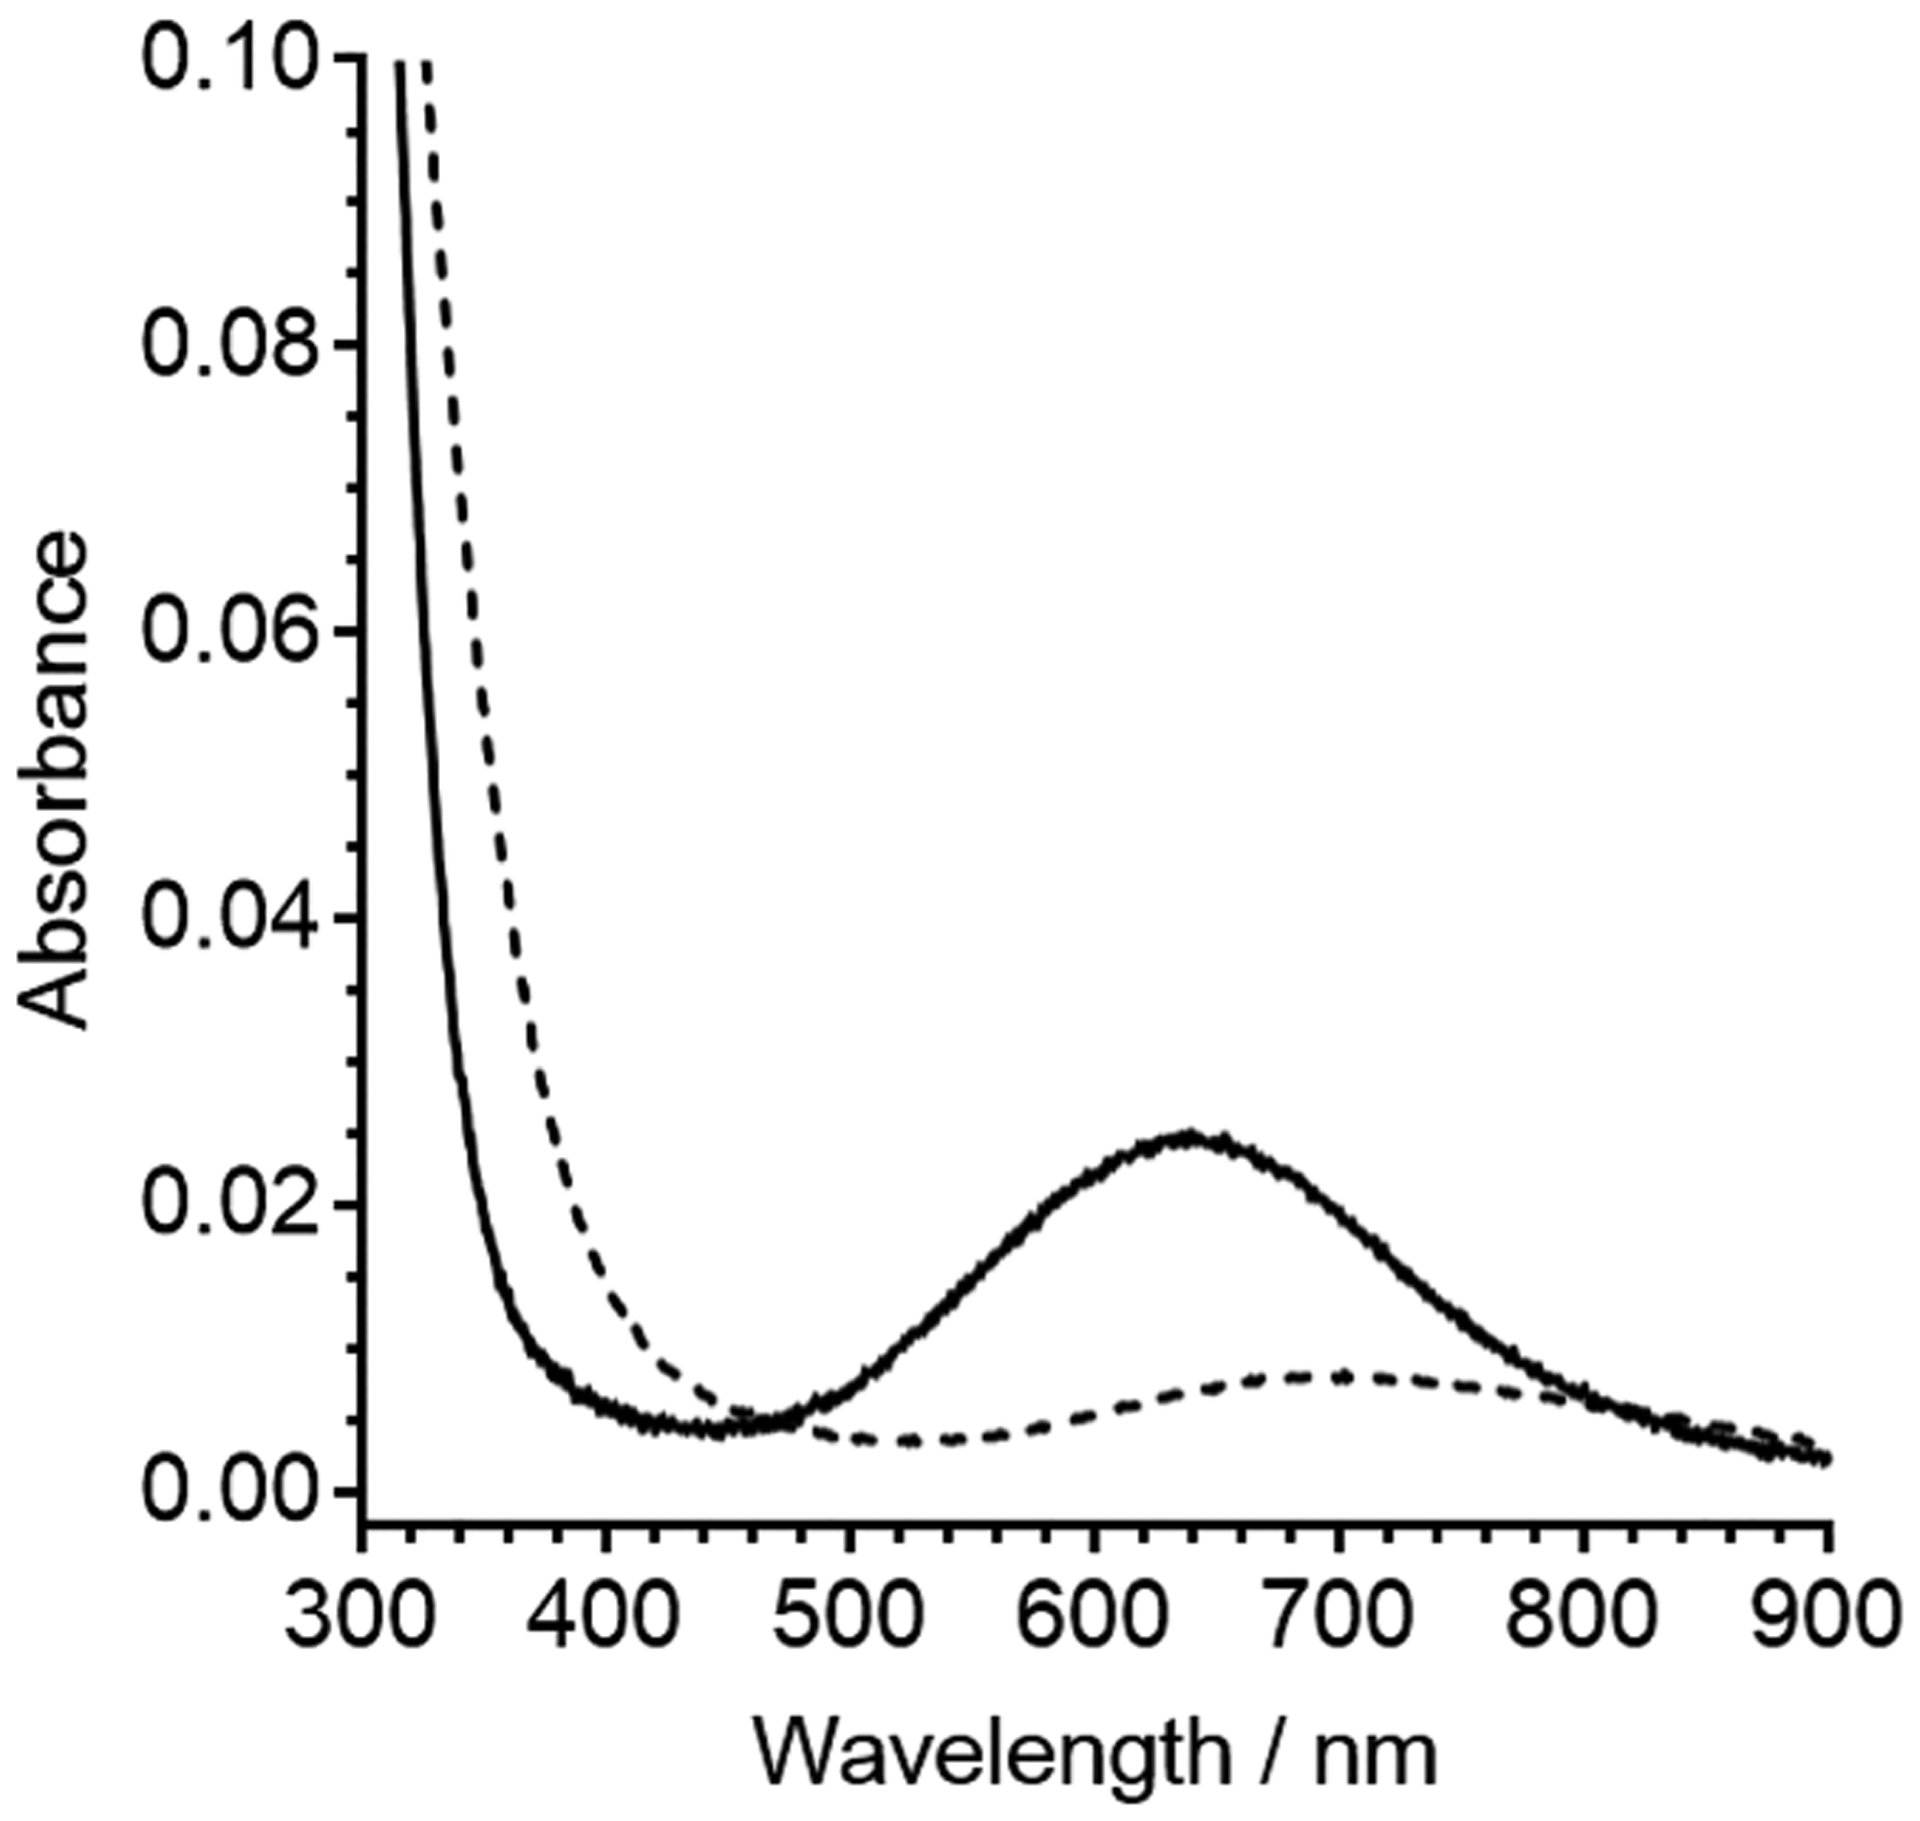
Figure 7.

Spectra depicting the d–d band from 300 μM Cu(II)/C-peptide (solid line) and 300 μM Cu(II) in 15 mM MOPS at pH 7.4 shown as a reference (dashed line). The wavelengths of maximum absorption for the d–d band as determined by the first derivative of Cu(II)/C-peptide and Cu(II) in buffer are 638 and 696 nm, respectively (Figure S10). The energy of the d–d band for Cu(II)/C-peptide suggests that Cu(II) is bound to at least one nitrogen ligand.
