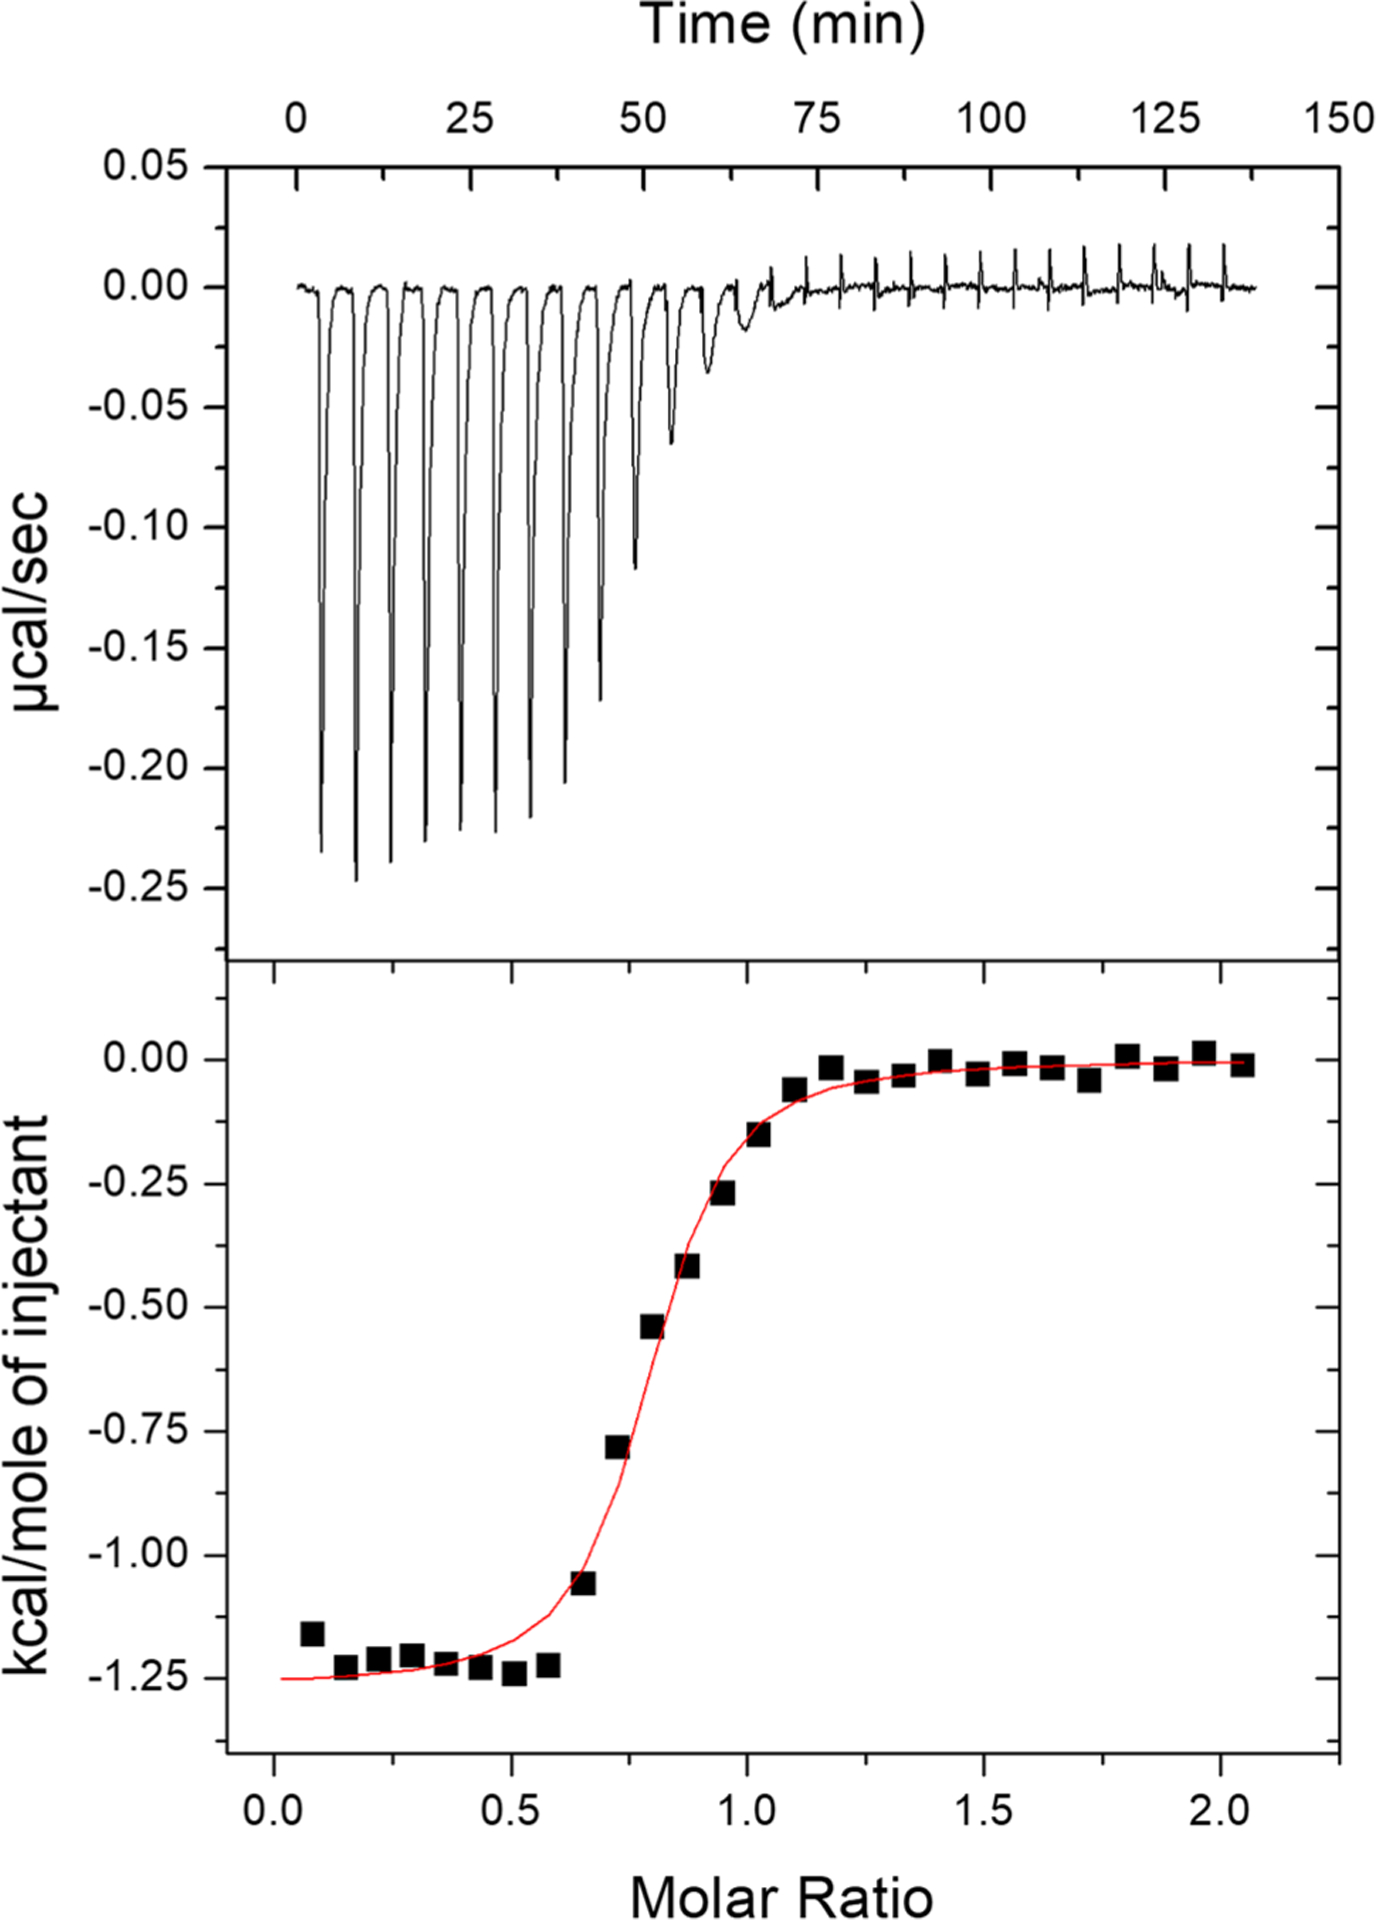
Figure 8.

Representative thermogram of 1.0 mM Cu(II) titrated into 100 μM C-peptide in 15 mM MOPS at pH 7.4 with a red fit line: n = 0.769 ± 0.008, KITC = 1.1 (±0.2) × 106, and ΔHITC = −1.27 ± 0.02 kcal mol−1. Buffer-independent thermodynamics are summarized in Table 2 and indicate a predominantly entropic driving force.
