
Figure 1.
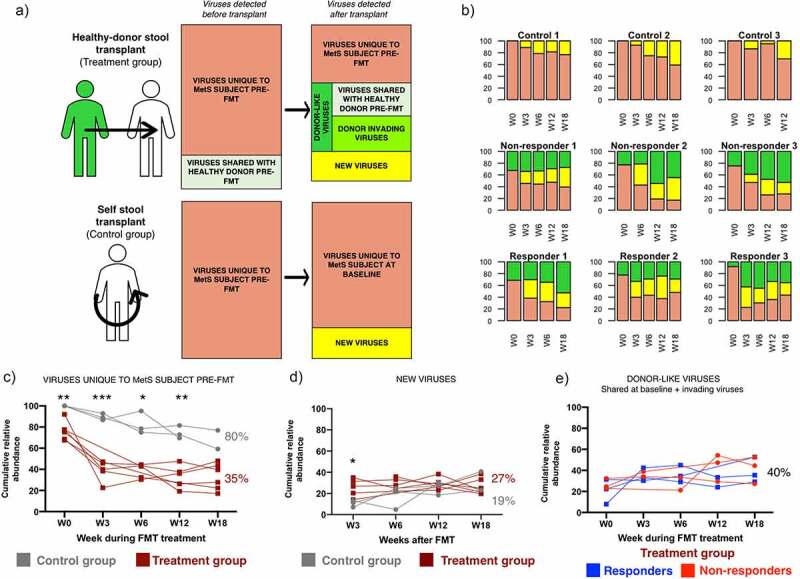
Changes in the viral community of MetS subjects after FMT. (a) Schematic representation of the composition of the viral community before and after FMT in recipients from the treatment group (top panel) and the control group (bottom panel). Individuals in the treatment group received the stool microbial community of a healthy donor (n=6). Individuals in the control group received their own stool microbial community (n=3). (b) Bar plots of the community structure after FMT in MetS subjects. Plots represent the cumulative relative abundance of the different viral categories in each individual at each timepoint (Before FMT treatment- W0 and after- W3, 6, 12, 18). (c, d, e) Changes through time in the different viral categories. The treatment group was further divided in responders (n=3) or non-responders (n=3) based on treatment outcome. Significance was determined through a mixed effect model to account for repeated measures and missing data points followed by Sidak’s multiple comparison test. Asterisks show adjusted p-values: * <0.05, **<0.005, ***<0.0005