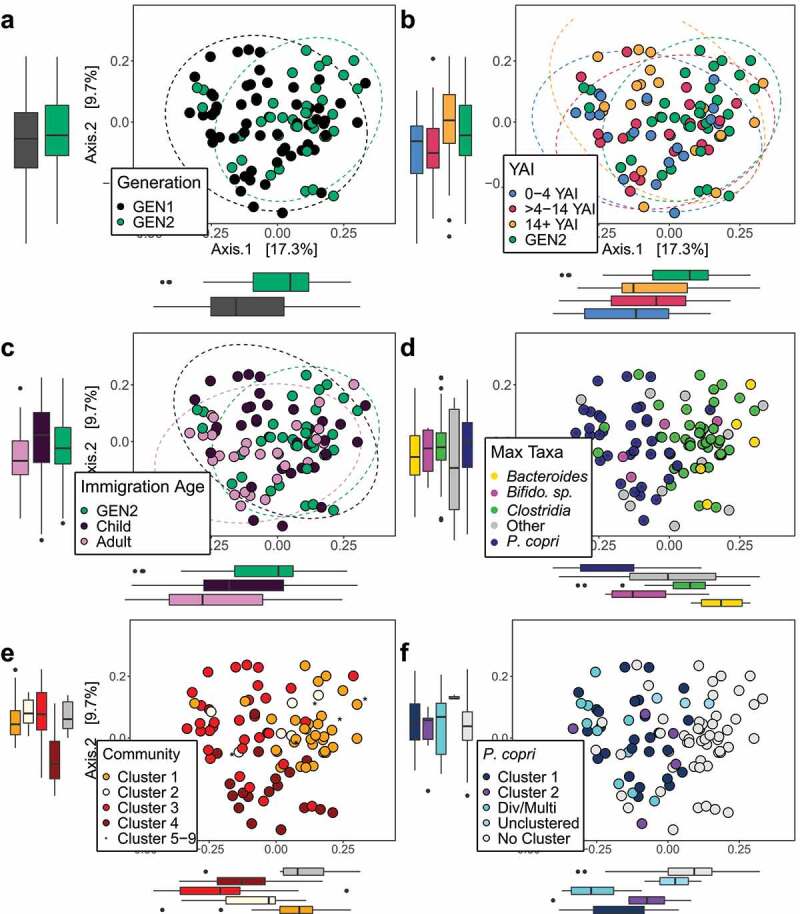
Figure 1.

Bray–Curtis PCoA plots of community dissimilarities shows separation of participants by (a) generation, (b) years after immigration (YAI) groups, (c) immigration as an adult (IA), and (d) maximum abundant taxa. Boxplots show the dissimilarity distances for each group, on each primary axis. (b) The recent immigrant group (0–4 YAI) and (c) those who immigrated as adults show the greatest dissimilarity from GEN2 (Pairwise ADONIS, p < .01). The samples are primarily separating by (d) maximum abundant taxa (ADONIS, R2 = 0.22, p < .05). Participants also show Bray–Curtis PCoA separation by the (e) four main species-composition community clusters identified using UPGMA-GMD hierarchical clustering and by the (f) two main P. copri pangenome clusters. Participants with divergent or multi-strain (Div/Multi) P. copri contained highly polymorphic P. copri that mapped outside of the pangenome species complex, suggesting the presence of unique strains or a greater proportion of multiple P. copri strains within these communities. ‘Unclustered’ samples contained P. copri pangenomes that formed individual UPGMA-GMD clusters. ‘No Cluster’ samples contained a P. copri relative abundance median <1% and were filtered out when following the default PanPhlAn analysis parameters
