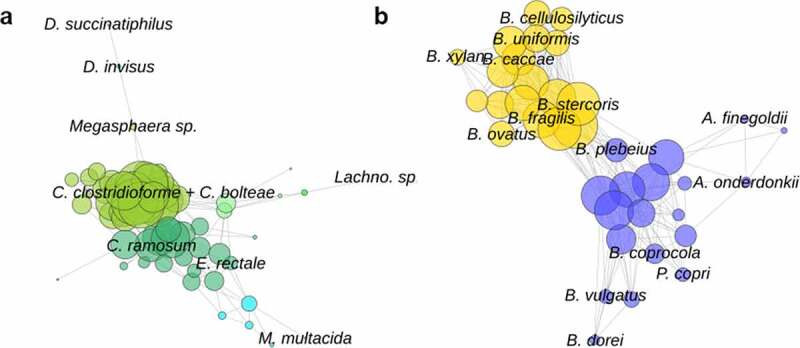
Figure 5.

(a) The largest Spearman correlation network of gene family presence, consisting of Firmicutes species, and (b) the second largest network consisting of Bacteroidetes species. Each point represents a species, the size of the point reflects the number of connections. Colors separate the network clusters. Certain species of interest are labeled on the figure. Species with functional differences, such as D. succinatiphilus and D. invisus, are located on the periphery of the networks
