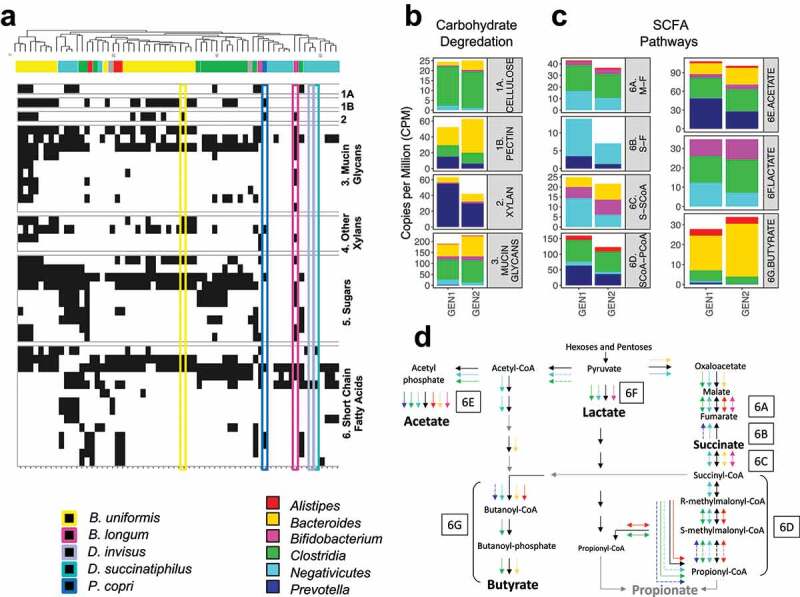
Figure 6.

(a) Hierarchical clustering of carbohydrate degradation and SCFA fermentation enzyme gene families. The presence of a gene family for a given species is indicated by a black tile. The associated taxa are indicated by the filled color bar at the top, and the rectangular boxes highlight the species of interest (for a detailed version, refer to Figure S6A). The average normalized Copies Per Million per generation group for the enzyme gene families in (b) non-digestible carbohydrate degradation and (c) SCFA fermentation. Enzyme gene families are labeled 1A, 1B, 2 and 3 for carbohydrate degradation and 6A – 6G for SCFA fermentation. (d) The presence of gene families in each SCFA fermentation pathway and their associated taxa (complete annotated pathways Figure S6B). Solid arrows indicate gene families identified in more than one species within the taxa group, while dashed arrows indicate only one associated species. Color-coding of the arrows corresponds to that shown in the legend of Figure 6A. Gene families shown as gray arrows were not observed in the data set. Gene families shown as black arrows, but with no taxa association, were identified in species outside of our interest group. The boxed letters for each component of interest correspond to Figure 6C
