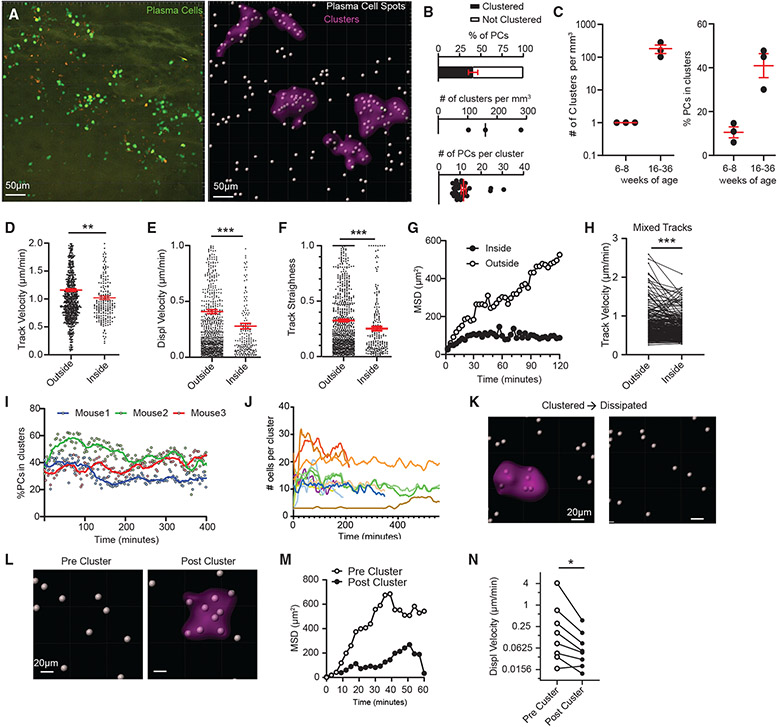
Figure 2. BM PC motility is reduced in PC clusters.
(A) Representative intravital 3D flattened image of raw (left) and processed (right) PCs to classify PCs and clusters.
(B) Percentage of all PCs in clusters (top), number of clusters normalized to imaging volume (middle), and number of PCs per cluster (bottom).
(C) Comparison of parameters in (B) at different mouse ages (n = 1 mouse/dot, 3 independent experiments).
(D–G) Comparison of PC tracks entirely inside or outside clusters.
(D) Track velocity.
(E) Displacement velocity.
(F) Track straightness.
(G) MSD.
(H) Per-cell analysis of track speed of mixed PC tracks that entered and exited clusters.
(I) Analysis of the percentage of PCs in clusters (as in B) over time.
(J) Number of PCs per individual cluster.
(K) Example spots of defined PCs before and after cluster dissipation.
(L–N) Spots of defined PCs before and after cluster formation (L), and (M) their respective MSD and (N) paired track velocity. Scale bar is 20 μm.
For (B)–(J) except (C), PCs from three 15- to 36-week-old mice were pooled and analyzed. All bars represent mean, and error is SEM. *p < 0.05, **p < 0.01, and ***p < 0.001 by Mann-Whitney tests, except (H), (N), which used paired t test analysis.

