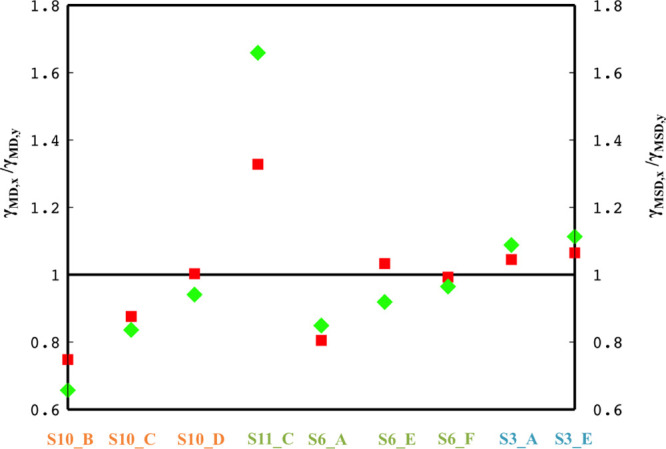
Figure 4.

Ratio of the scaling exponents, γMD,x/γMD,y (red squares) and γMSD,x/γMSD,y (green rhombs) is illustrated. The i.d. of each micelle is indicated in the vertical axis of the graph, and the color code stands for the different irradiation flux; orange for 1.6 e–/Å2 s, dark green for 2.6 e–/Å2 s, and light blue for 5.6 e–/Å2 s.
